


May 16, 2019
By Adam Bechle, Coastal Resilience Outreach Specialist, Wisconsin Sea Grant
On May 6th, 2019, the United States Army Corps of Engineers released its May 2019 six-month Great Lakes water levels forecast, available at this link, indicating that some of the Great Lakes are projected to eclipse record highs for the summer months. The U.S. Army Corps of Engineers – Detroit District also issued a News Release on these forecasts here: https://www.lre.usace.army.mil/Media/News-Releases/Article/1837768/great-lakes-water-levels-expected-to-set-record-highs/
What’s going on with water levels in the Great Lakes?
Th U.S. Army Corps of Engineers forecast projects that Lake Superior and Lake Erie are likely to exceed record high water levels for the month of May. It is even possible that these lakes could surpass their all-time record high levels later this summer. Amazingly, Lake Ontario has risen 2 feet in the last month (April 15 to May 15). Lake Michigan is not expected to exceed the record water levels set in 1986 (see image below), though the forecast indicates that Lake Michigan will rise higher than it was last summer, likely to within one foot of its record highs.
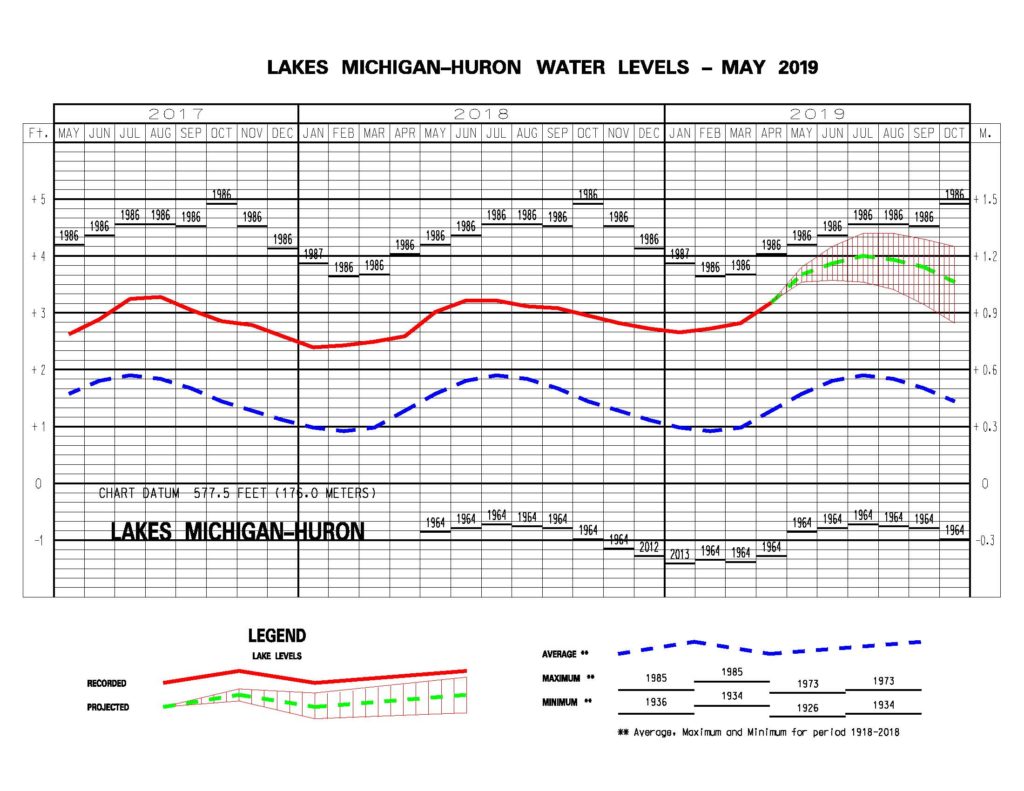
Six month water level forecast for Lake Michigan issued May 2019. Source: U.S. Army Corps of Engineers – https://www.lre.usace.army.mil/Missions/Great-Lakes-Information/Great-Lakes-Water-Levels/Water-Level-Forecast/Monthly-Bulletin-of-Great-Lakes-Water-Levels/
How do high lake levels affect the coast?
High water levels allow erosive waves to reach higher elevations on the shore where they batter shoreline infrastructure and eat away at the base of bluffs and dunes. High water levels can also make coastal flooding in low-lying coastal areas more likely. In ports and harbors, high water can cause operational and safety issues if a large elevation difference exists between vessel and dockage.
Why are lake levels rising?
In short, the water supply into Lake Michigan has been above-average for the seven consecutive months. This water supply is measured as the Net Basin Supply, which is composed of precipitation onto the lake and runoff into the lake minus evaporation out of the lake. In general, when Net Basin Supply is positive, more water enters the lake than leaves, yielding a rise in lake levels. A five-year history of the measured Net Basin Supply is shown below (also available from the U.S. Army Corps of Engineers at this link), where blue indicates a positive Net Basin Supply and red is a negative Net Basin Supply. As a whole, the Great Lakes has seen a lot more blue than red in the last five years, indicating a consistently positive Net Basin Supply which has driven our high lake levels. You may note that April 2019 had a rather large positive Net Basin Supply for Lake Michigan – this was in part because precipitation in the Lake Michigan basin was above average by 30%. Our recent wet conditions can also be visualized in map from in the the Midwest Regional Climate Center’s winter 2019 report, available here, which indicates that nearly the entire Great Lakes watershed received above average precipitation this past winter.
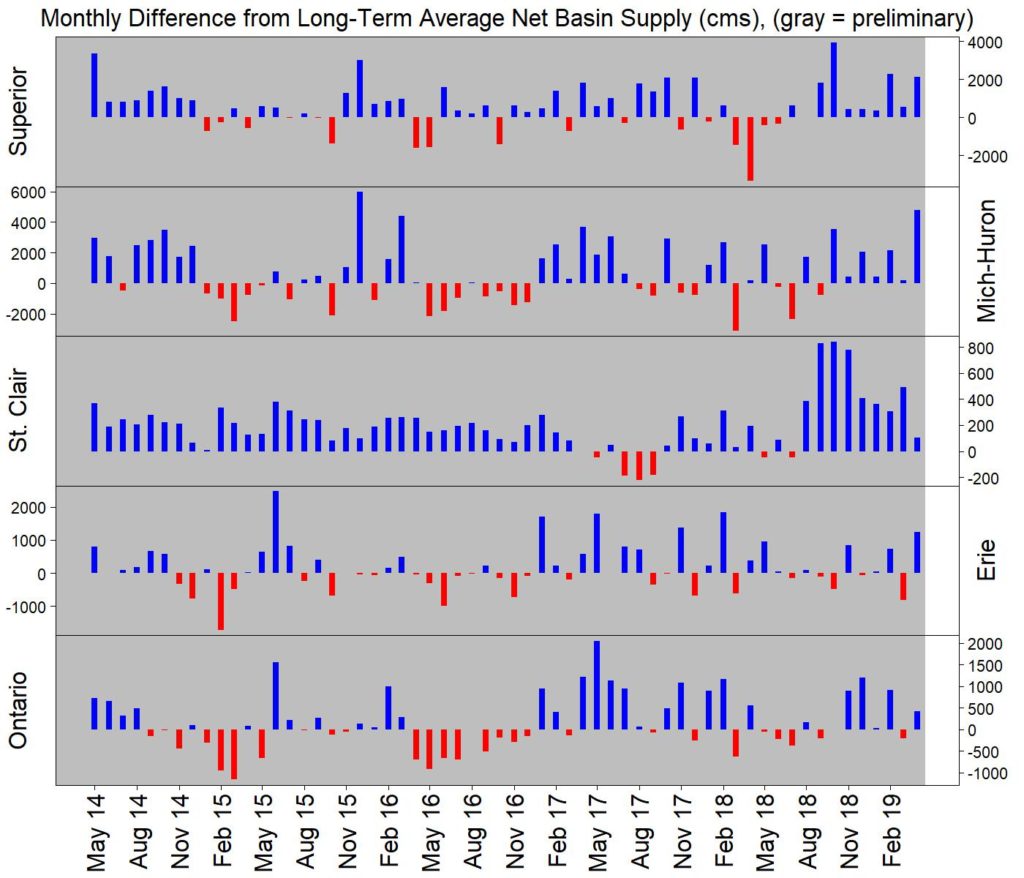
Net Basin Supply to the Great Lakes, where blue indicates a positive NBS and red is a negative NBS
Source: US Army Corps of Engineers – http://lre-wm.usace.army.mil/ForecastData/GLBasinConditions/monthlyNBSPast5Years.jpg
Where can I go for more information?
Great Lakes Water Budgets from the University of Michigan gives a bit more information into what makes the lakes go up and down
The US Army Corps’ Great Lakes Information page has tons of details on water levels. We featured the monthly forecasts as a Resource of the Month here.
Our Resilience Resources webpage has links to many resources on dealing with issues related to water level fluctuations.