


To provide needed predictions of how natural processes and human interventions combine to affect the bluff, beach and infrastructure in the southeastern Wisconsin, we will analyze historic data and index model methods to assess a range of environmental and development scenarios for the region. The steps in this analysis are described below along with a list of complementary resources that already exist.
Compile and Analyze Historic Shoreline Recession Data 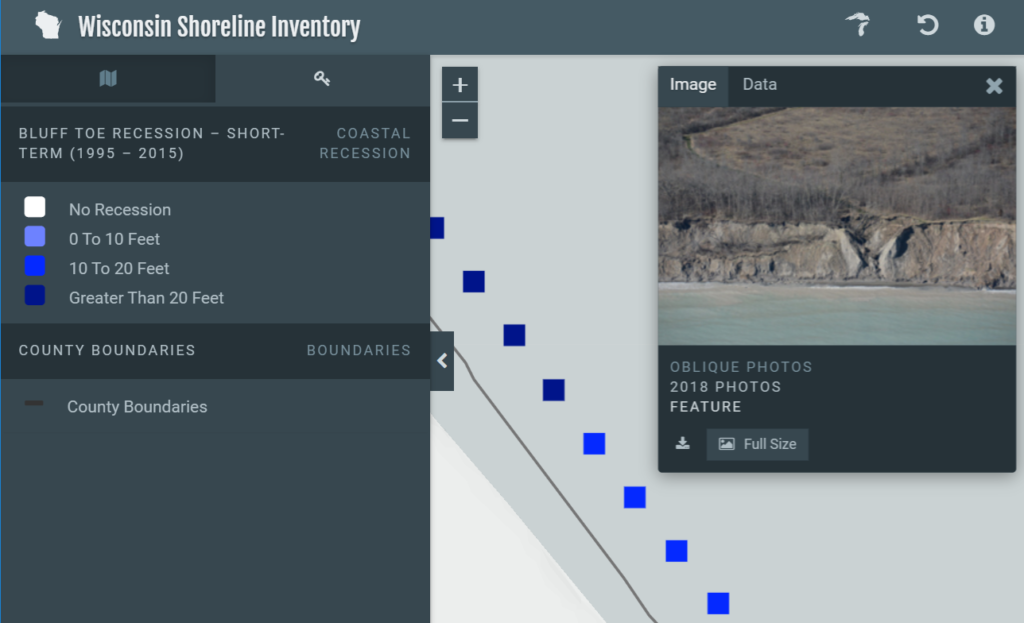
Bluff recession and beach evolution has been measured from historic aerial photographs from 1956 to 2015. These measurements are available on the Wisconsin Shoreline Inventory and Oblique Photo Viewer. See our tutorial video to understand how to use the viewer. We are now performing a detailed shoreline recession analysis to characterize the shoreline response to both historic environmental conditions, including lake level changes and extreme storm waves, and historic anthropogenic changes such as the construction of shore protection structures.
Assess Shoreline Recession Scenarios
Expected Completion – Fall 2019
We will apply empirical index model relationships to estimate the effects of potential scenarios of storm waves, water levels and shore protection structures on erosion and accretion along the coast. The effect of possible extreme storm waves and water levels conditions on shoreline recession will be estimated using the cumulative wave impact height (CWIH) method. Shoreline armoring scenarios will also be developed to quantify the range of impacts that various types of shore protection may have on the shoreline. These scenarios will provide a range of shoreline recession rates that might be expected in the future.
Develop a GIS Shoreline Recession Database
Expected Completion – Summer 2020
A GIS-based visualization tool will be created to share shoreline recession data and scenarios. This tool will overlay historic recession data and potential scenarios on their applicable shoreline reaches in the region to illustrate the possible range of shoreline changes that could be expected to occur at a site, not just the historic conditions. These maps and tools will provide easily accessible and readily usable information to aid decisions by both public and private stakeholders.
Related Resources
Wisconsin Coastal Atlas – A technology platform that provides access to maps, data, catalogs, tools, and information to support decision-making about Wisconsin’s Great Lakes coast
Wisconsin Shoreline Inventory and Oblique Viewer – A web mapping tool to view shoreline condition assessments (1976 and 2007) and oblique aerial photos (1976, 2007, 2012, 2016 and 2017) for most of Wisconsin’s Great Lakes coast
Lake Michigan Shoreline Recession and Bluff Stability in Southeastern Wisconsin: 1995 – A report on the 1995 status of bluff recession and bluff stability on selected bluff slopes on the Kenosha, Racine, Milwaukee and Ozaukee counties shoreline
Lake Level Viewer – A web mapping tool to examine the potential impacts of lake level changes on shoreline position and water depth in the Great Lakes
Great Lakes Water Level Dashboard Project – A dashboard interface to access and visualize more than 150 years of Great Lakes water level data, as well as seasonal forecasts of future lake levels