


December 6, 2019
Lydia Salus, Coastal Resilience Project Assistant, Wisconsin Sea Grant
One question our team has been hearing a lot lately is “what will cause Lake Michigan’s water levels to go back down?” This is the perfect time of the year to discuss this question because the fall and winter seasons are typically when water levels in the Great Lakes drop due to decreasing precipitation and increasing evaporation. Let’s discuss why this is and how it impacts Lake Michigan.
Fluctuations in Water Levels
Great Lakes water levels are very dynamic and can exhibit long-term trends over decadal time scales. In the graph below depicting historic Lake Michigan Water levels from 1920 to 2020, we can see that Lake Michigan’s water levels have fluctuated between periods of highs and lows that persisted over decades. Water levels over these multi-year time scales are mostly impacted by climate dynamics, such as whether precipitation is above average which has driven our current water levels. We can also see many smaller blips that occur every year that represents the seasonal cycle of water levels that peak in the summer and drop in the winter. At the heart of all these fluctuations in water levels is the balance of water into and out of the lake.
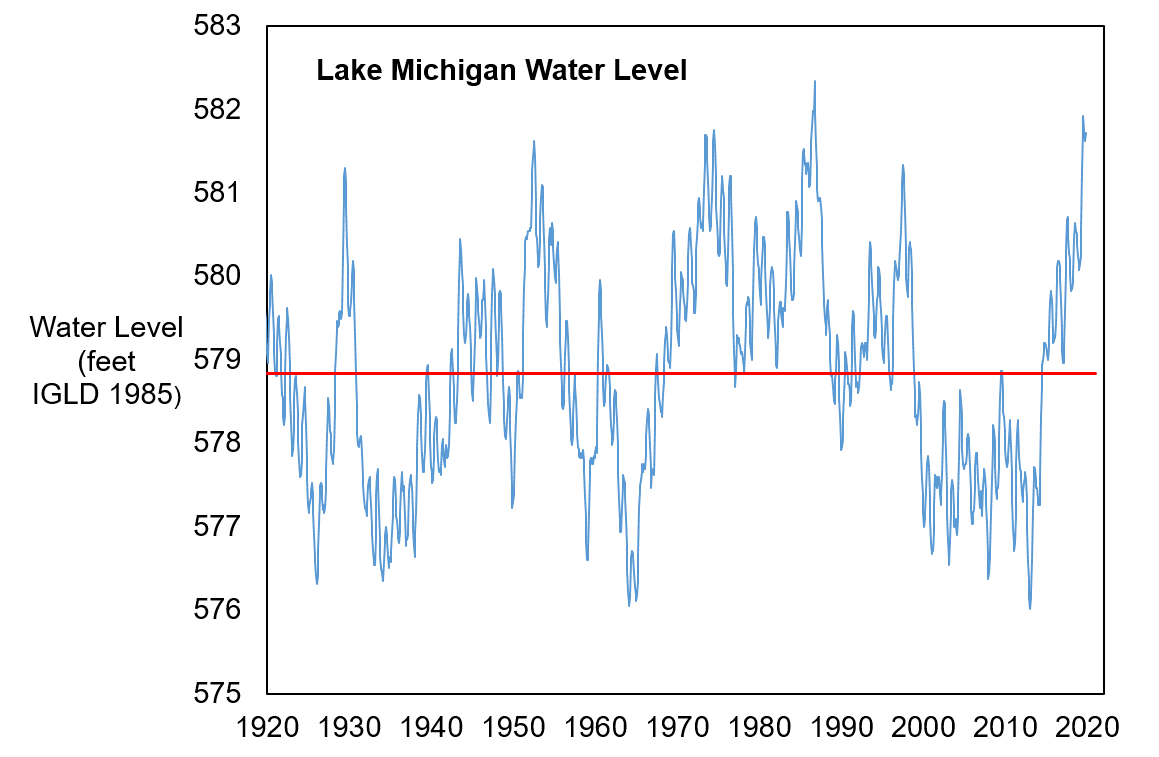
Great Lakes Long Term Water Level Data provided by Great Lakes Environmental Research Laboratory. Retrieved from
https://www.glerl.noaa.gov/data/wlevels/levels.html#observations
Evaporation & the Water Balance
In previous blogs we’ve discussed that changes to Lake Michigan’s water levels are primarily determined by the Net Basin Supply. The Net Basin Supply (NBS) can be described as the amount of precipitation (P) and runoff (R) entering the Lake minus evaporation (E) and the amount of water leaving the Lake. As seen in the graph below, the annual peak Net Basin Supply occurs when runoff peaks in the spring and experiences its minimum when over-lake evaporation peaks in the winter. These maximums and minimums in Net Basin Supply corresponds to the seasonal water level rise and fall.
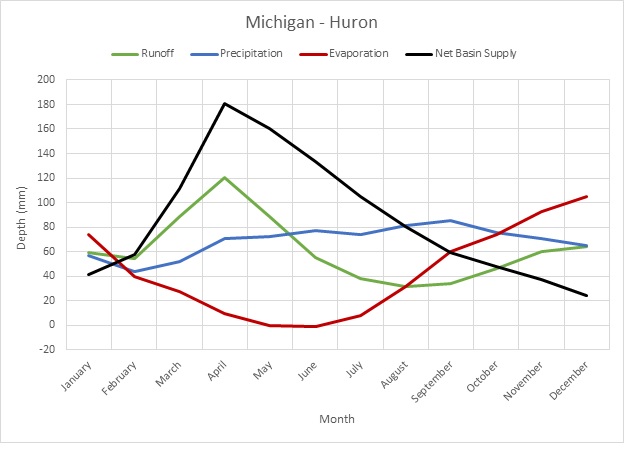
Michigan-Huron Average Net Basin Supply. Created by Lydia Salus, Coastal Resilience Project Assistant.
Typically, the Net Basin Supply is positive in the spring and summer when precipitation is greater than evaporation and negative in the fall and winter when evaporation is greater than precipitation (see the above graph). If the inputs to the Lake are greater than the amount of water leaving lake, water levels will increase or remain high. However, this graphic represents an “average” year and the weather we experience dictates the Net Basin Supply for a given year.
Drivers of Evaporation
In general, for evaporation to occur there needs to be a “temperature gradient” and “moisture gradient.” A gradient just means that there needs to be a difference in temperature between the air and the lake as well as a difference in moisture. When the temperature of the air is cooler than the temperature of the water and the air is unsaturated, or does not have a lot of moisture, then evaporation can occur.
For large amounts of evaporation to occur, Lake Michigan’s water temperature needs to be warm and the air temperature needs to be cool, relative humidity needs to be low, and wind speeds need to be high. Most evaporation occurs over Lake Michigan in the fall when these conditions are met.
To get a negative Net Basin Supply for water levels to decrease, total evaporation needs to be higher than total precipitation and runoff. Ideal conditions for this to occur would be a cool, dry fall and winter followed by a warm, dry spring.
What’s Happening This Year?
A five-year history of evaporation on the Great Lakes can be seen below, with blue representing above average evaporation and red representing below average evaporation. Recently, Lake Michigan experienced above average evaporation in August, October, and November of this year and below average evaporation in September. However, heavy precipitation throughout the summer and fall has outweighed the evaporation. This has led to a positive Net Basin Supply meaning that more water entered the Lake than left the Lake.
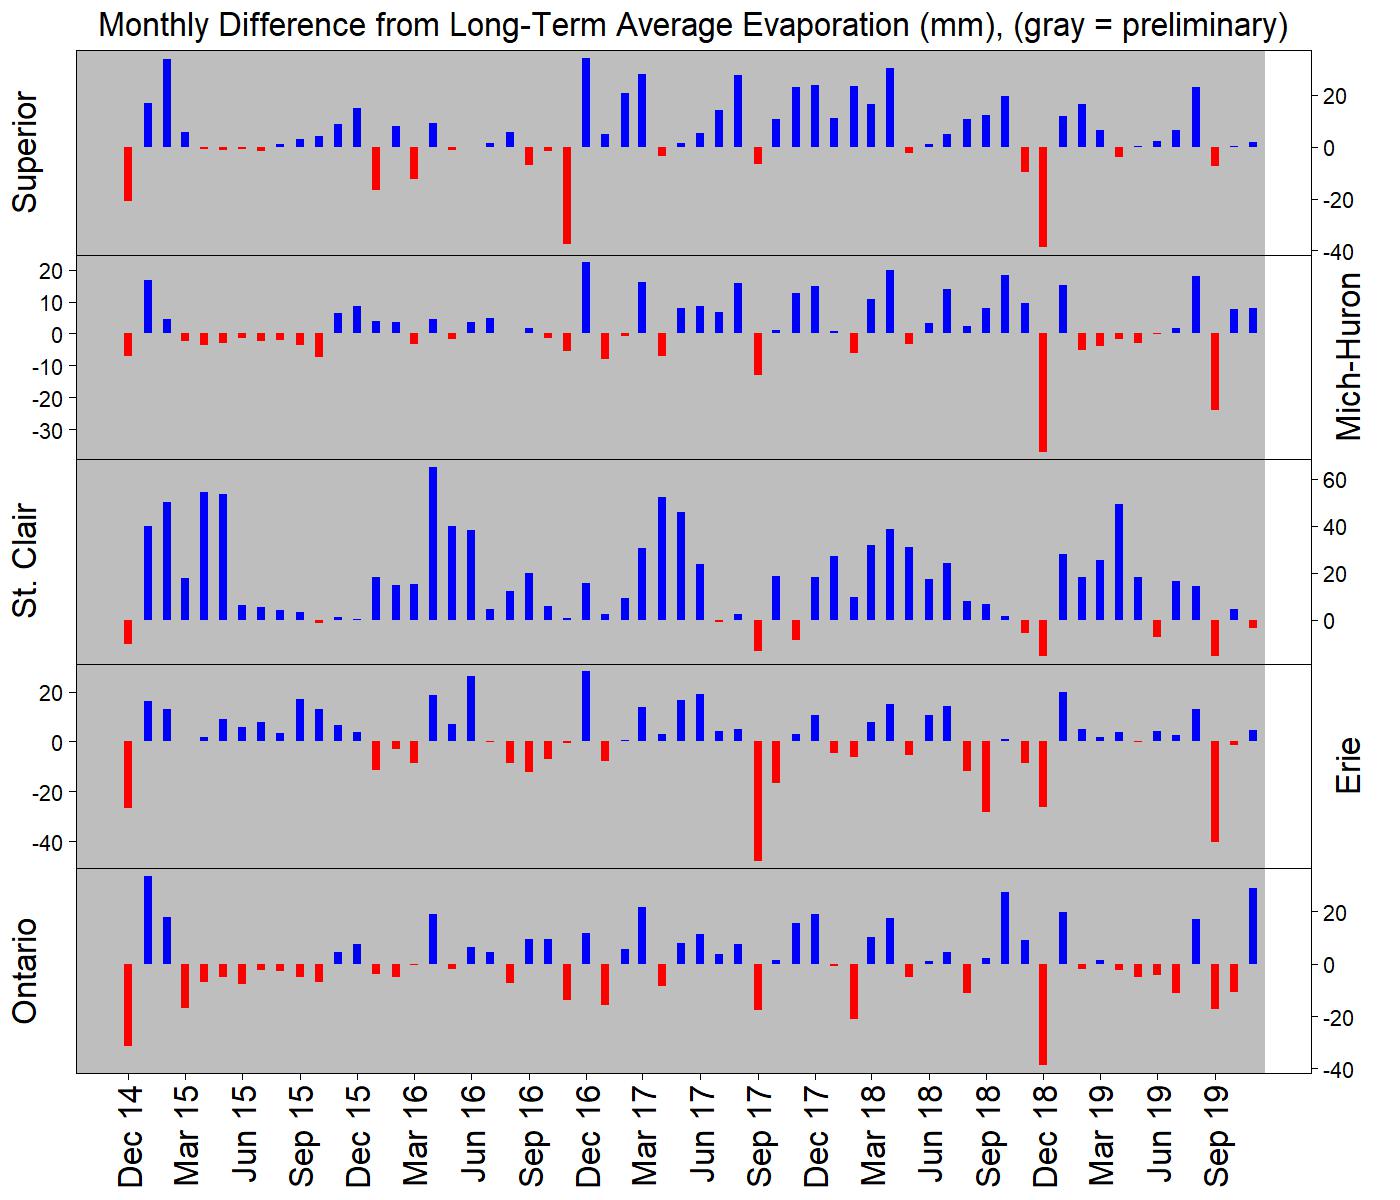
Modeled evaporation the Great Lakes, where blue indicates above average evaporationand red is below average evaporation: US Army Corps of Engineers – http://lre-wm.usace.army.mil/ForecastData/GLBasinConditions/monthlyevapPast5Years.jpg
This positive Net Basin Supply shows up in our recent water level increase and forecasts for future water levels. As you can see by the predicted water levels shown by the dashed green line in the image below, Lake Michigan is hardly experiencing the “typical” decline in water levels that it normally does at this time of year (blue line). While we’ve seen close to average evaporation in 2019, precipitation has been high which is why we are not seeing that seasonal decline. Continued wet conditions like this will keep water levels on Lake Michigan near or above record highs into 2020. We are all hoping the new year brings us dry conditions and good evaporation gradients to turn that Net Basin Supply negative for a while.
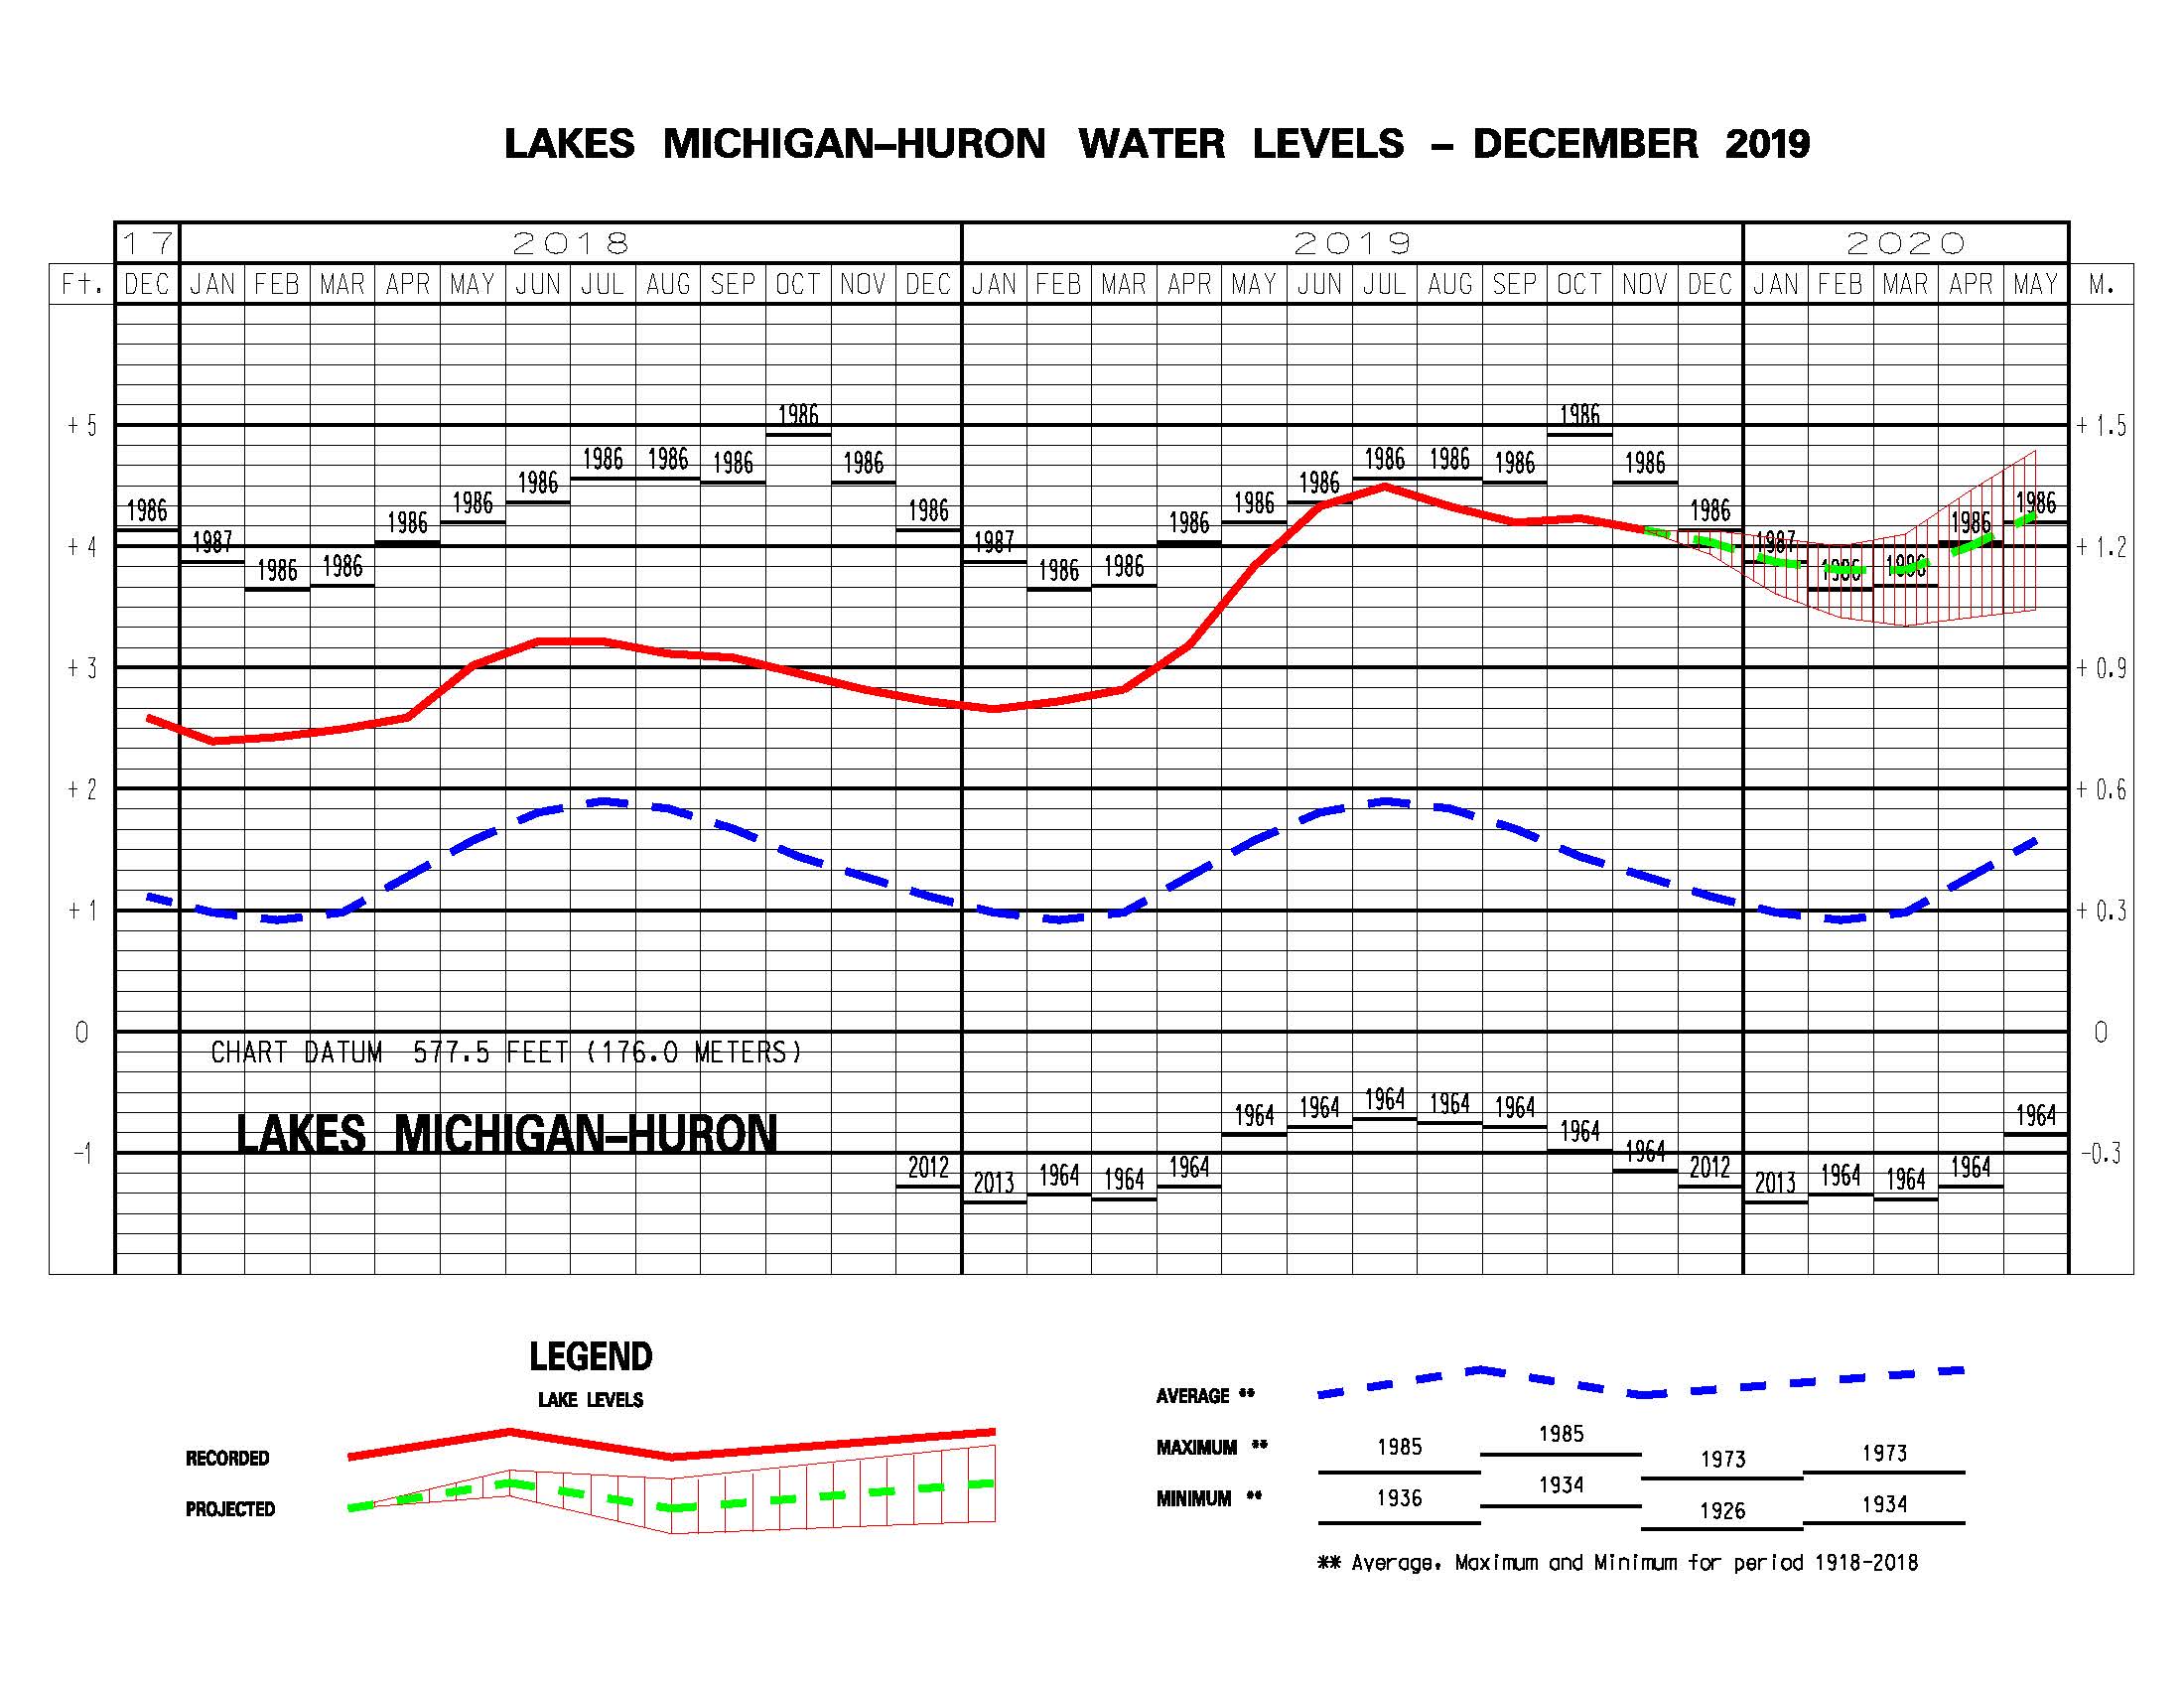
Six-month water level forecast for Lake Michigan issued November 2019. Source: U.S. Army Corps of Engineers – https://www.lre.usace.army.mil/Missions/Great-Lakes-Information/Great-Lakes-Water-Levels/Water-Level-Forecast/Monthly-Bulletin-of-Great-Lakes-Water-Levels
Additional Resources: