


July 3, 2020
By Kayla Wandsnider, Coastal Resilience Project Assistant, Wisconsin Sea Grant
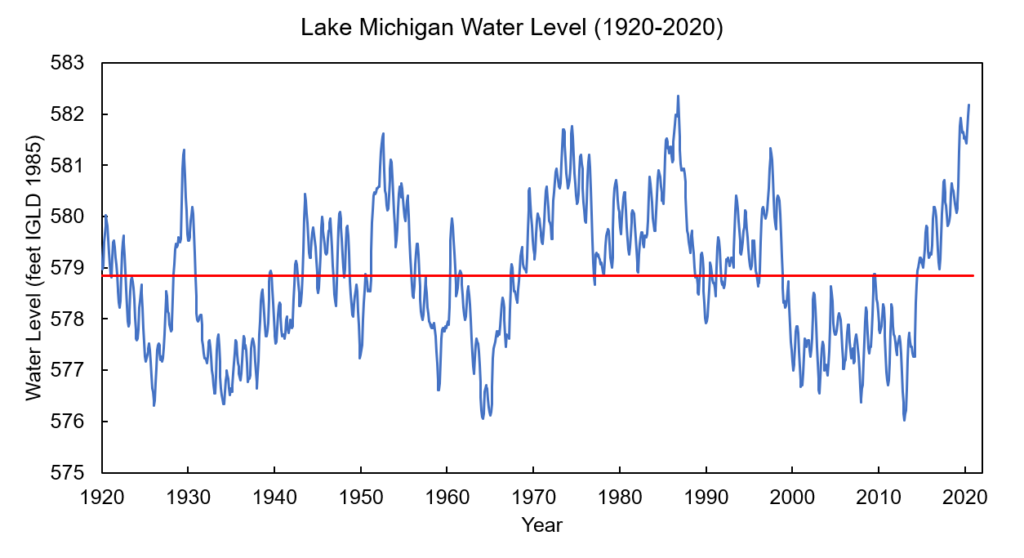
The water levels on all the Great Lakes still remain above their long-term monthly averages as of July 2020. Lake Michigan surpassed its record-high monthly mean for June previously set in 1986. This is the sixth monthly record set for Lake Michigan in our recent period of high water levels. Lake Michigan water levels increased by about one inch from May to June. While Lake Michigan’s seasonal rise is still occurring, water levels are expected to level off and potentially decrease through August.
Here are five things to know about water levels on Lake Michigan for July 2020.
What are the current water levels on Lake Michigan?
The water level of Lake Michigan as of July 3, 2020 is at an elevation of 582.22 feet above sea level (from the International Great Lakes Datum). To put this level into perspective, here are some statistics for Lake Michigan relative to the period of water level records measured from 1918 to present: (statistics from USACE’s Weekly Water Level Update and USACE’s Water Level Summary).
| Compared to… | Current Water Levels are… |
| One month ago | 1 inch higher |
| One year ago | 4 inches higher |
| Long-term July monthly average (1918 to 2019) | 34 inches higher |
| Record July monthly mean (set in 1986) | 3 inches higher |
What is the outlook for future water levels?
The US Army Corps of Engineers (USACE) projects higher than average and potentially record high water levels to persist through the summer (see six-month forecast issued for July 2020 below).
Water levels continued their seasonal rise and increased by 1 inch over the last month. The USACE is forecasting that water levels will level off and start to decrease throughout the rest of the summer. An increase in water levels generally occurs during the spring as precipitation and snowmelt typically increase. They tend to level off then decrease at the end of the summer and through the fall as temperatures cool and evaporation increases. In an average year, water levels vary seasonally by about one foot from a peak in summer to a low in winter, though every year is different.
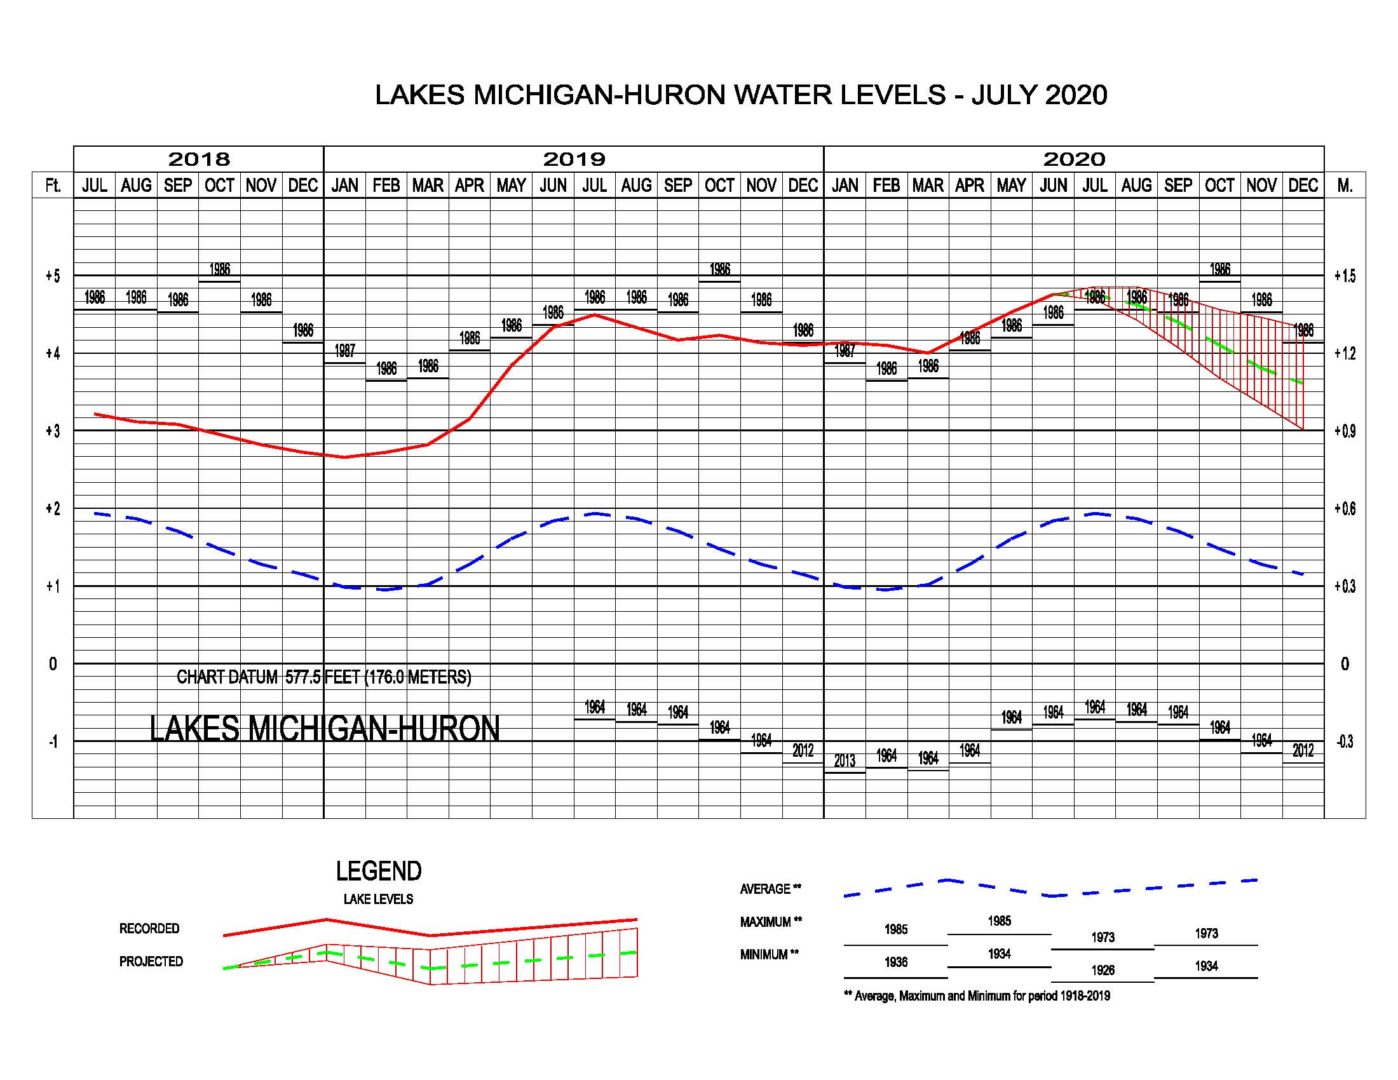
Six-month water level forecast for Lake Michigan issued for July 2020. Source: U.S. Army Corps of Engineers – https://www.lre.usace.army.mil/Missions/Great-Lakes-Information/Great-Lakes-Water-Levels/Water-Level-Forecast/Monthly-Bulletin-of-Great-Lakes-Water-Levels
What is behind Great Lakes water level fluctuations?
The story of Great Lakes water level changes is told by Net Basin Supply. Net Basin Supply (NBS) accounts for water going into a lake in the form of precipitation and runoff minus water leaving a lake due to evaporation of water from the lake surface. In general, when Net Basin Supply is positive, more water enters the lake than leaves, causing a rise in lake levels. Over the last five years, Net Basin Supply has been consistently positive, driving all the Great Lakes to rise (Click here for more detail).
In June 2020, the Lake Michigan water level crept higher due to an above average Net Basin Supply. Lake Michigan’s NBS in June 2020 was 6,000 cubic feet per second above the long-term average June NBS (recorded between 1900-2008). This is equivalent to an additional 1.16 billion gallons of water entering Lake Michigan compared to an average June, or nearly 176 thousand Olympic swimming pools of extra water. Spread across the lake, this amounts to an additional 0.15 inches of water above the normal seasonal rise from May to June. The above average NBS was likely driven in part by precipitation, which was 2% above average over the entire Lake Michigan basin for the month of June 2020.
| June 2020 NBS: | 210,000 cfs |
| June Average (1900 – 2008): | 204,000 cfs |
So far in 2020, Lake Michigan’s NBS has been above average by 48,000 cubic feet per second. This has resulted in an additional 5.6 trillion gallons of water entering Lake Michigan so far this year compared to a normal year. This has been offset somewhat by above average outflows from the Lake Michigan-Huron basin to Lake Erie through the St. Claire River. However, such a substantially above average NBS to date in Lake Michigan has kept water levels at record levels in 2020.
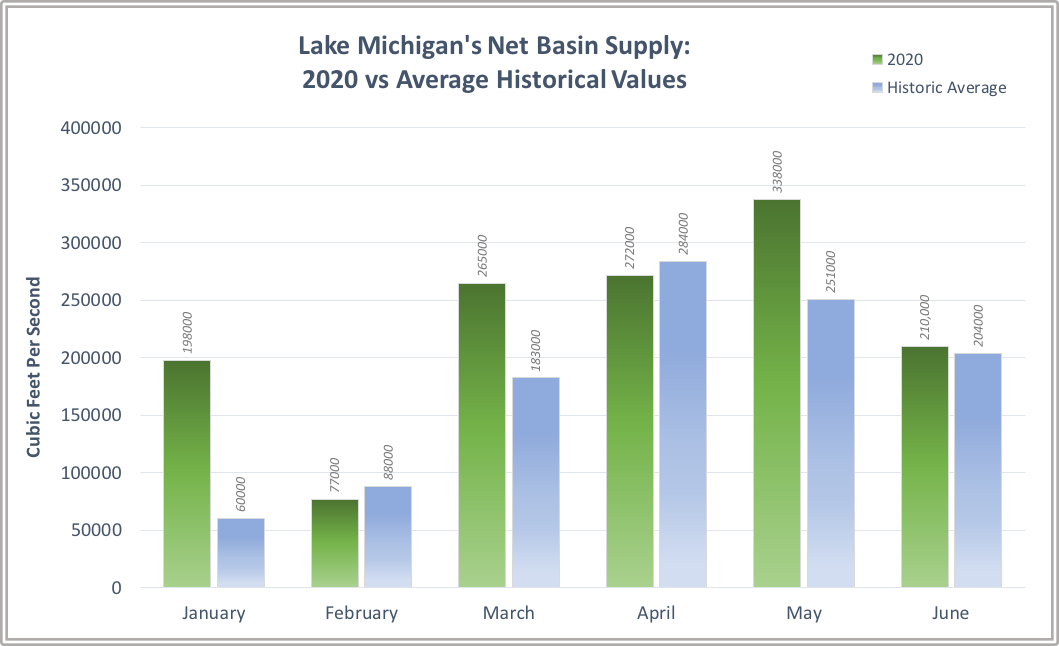
This image shows the comparison between the current and the average NBS recorded between 1900 – 2008. Calculations based on the Army Corps of Engineers Great Lakes Basin Hydrology for June. https://www.lre.usace.army.mil/Portals/69/docs/GreatLakesInfo/docs/BH-TABLEBOJul20.pdf?ver=2020-07-01-120141-473
What would make water levels go down?
The historic record shows that water levels in the Great Lakes fluctuate between periods of highs and low with changes in precipitation and evaporation, so we know our high water levels will not be around forever. But what are the perfect conditions that would help water levels go down sooner rather than later? According to Keith Kompoltowicz, Deputy Chief of Engineering at the USACE’s Detroit District “If the faucet turns off, and we return to very dry, a hot dry summer. Those would be the conditions that would pull water levels down. Big picture is that we’re looking at another year of very high and even record high water levels, and the impacts associated with those are going to remain.” Those would be the ideal conditions – low precipitation and runoff with high evaporation – to get a below-average Net Basin Supply which would draw down lake levels. Forecasts are predicting that it is unlikely that water levels will go down in the summer of 2020.
Five places you can find more information:
 Our Coastal Hazards page for details about the impacts of high water levels, including erosion, flooding, and navigation issues.
- Our blog post Resources for Great Lakes Coastal Property Owners: Where do I start? has links to many resources to help
- understand coastal hazards
- weigh the risks coastal hazards pose to property
- understand options for addressing these hazards
- get started on implementing actions if necessary.
- The Great Lakes Water Budgets from the University of Michigan gives more information about what makes the lakes go up and down
- The US Army Corps’ Great Lakes Information page has tons of details on water levels.
- Our Resource of the Month featured here.