


August 20, 2020
By Kayla Wandsnider, Coastal Resilience Project Assistant, Wisconsin Sea Grant
Duluth, MN harbor, Lake Superior sea smoke. Photo credit: duluthharborcam.com
Myth Busting Water Levels Decreases on the Great Lakes
Water levels on the Great Lakes are a major issue impacting coastal communities right now. On the Great Lakes, the terms “water level” or “lake level” typically refers to the water elevation on the lake averaged over a month. Lake Michigan-Huron has been at above average lake levels since 2015 and since the beginning of 2020, the lake levels on Lake Michigan-Huron have set new monthly record highs every month (note: Lake Michigan and Lake Huron share the same water level and are often referred to as Lake Michigan-Huron). A big question on people’s minds has been, “How and when will these water levels decrease”? With recent headlines mentioning that Lake Michigan-Huron’s water level has likely reached its peak for 2020, we may think that a decrease is starting now. While it is true in some sense, Great Lakes water levels are not that simple. This blog will expose a few myths and facts regarding decreasing water levels on the Great Lakes around this time of year. We will cover 5 of them here.
Myth 1: Water levels are starting to decline, which means next year the water levels won’t be as high and there won’t be as much flooding.
Fact: This is an assumption that doesn’t take into account long versus short term water levels. The Great Lakes are very dynamic alternating between long periods of high and low water levels in addition to going through phases of seasonal variability. Both the long-term and short-term changes are based on the current climate regime and even weather patterns that occur on the other side of the globe. Below is a graph that portrays surface water elevation data for the Lake Michigan-Huron basin between 1918 and 2020. As you can see the lakes fluctuate between below average and above-average water levels. The current trend, starting around 2015, has been above average water levels.
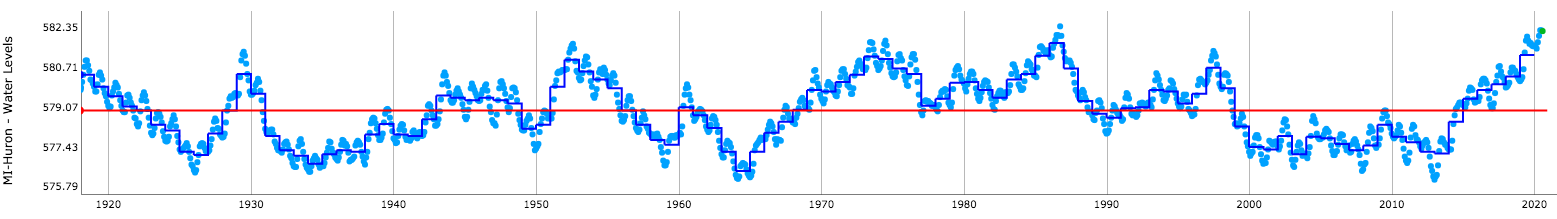
Water level data for Lake Michigan-Huron from 1918 – 2020. https://www.glerl.noaa.gov/data/dashboard/GLD_HTML5.html
The seasonal variability in water levels is fairly consistent: rising water levels through the spring and summer peaking around July, then declining water levels through the fall and winter with a low point around February. Right now, we are headed into the seasonal fall decline. The image below shows the past 3 years of water level trends and predicted water levels for the next 6 months. Since January 2020 every consecutive month has broken water level records that have been held since the last period of high water in 1986. Additionally, you can see, the projected water level trend (green dashed line) follows the average (blue dashed line) seasonal decline in water levels through January 2021.
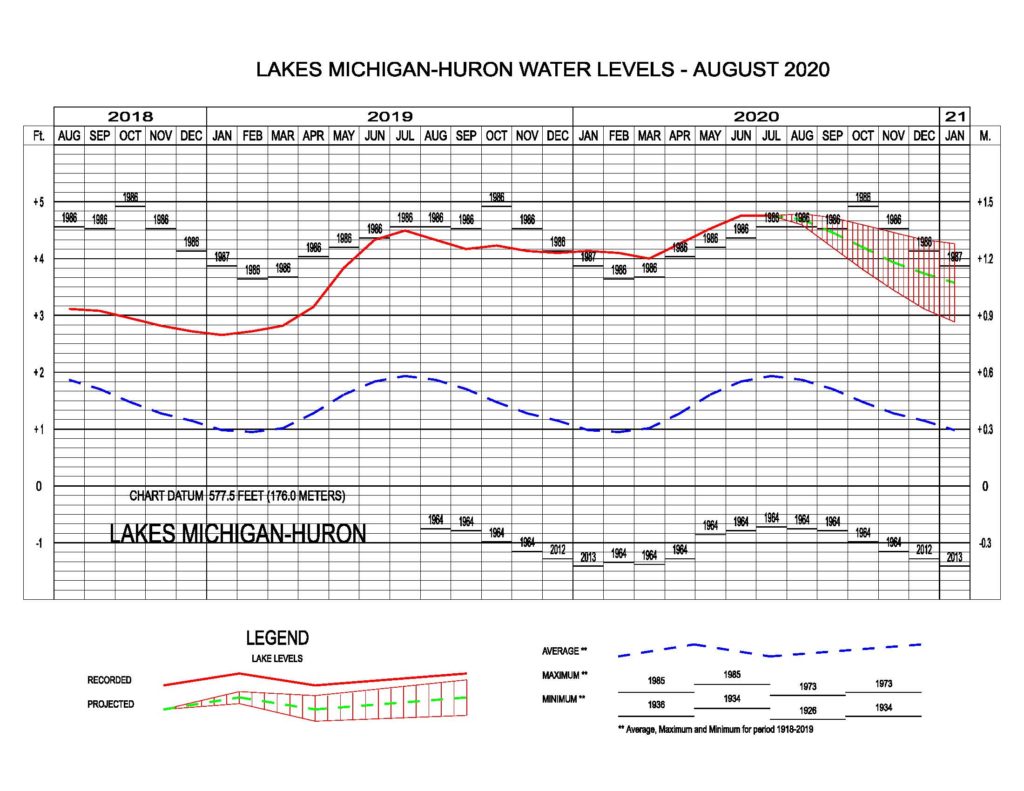
Six-month water level forecast for Lake Michigan issued August 2020. Source: U.S. Army Corps of Engineers – https://www.lre.usace.army.mil/Missions/Great-Lakes-Information/Great-Lakes-Water-Levels/Water-Level-Forecast/Monthly-Bulletin-of-Great-Lakes-Water-Levels
Just as Lake Michigan-Huron has risen to record highs over a period of many years, it will take multiple years for water levels to return to near average levels. Currently, Lake Michigan-Huron is at about three feet above the long-term average water level. The largest one-year drop in water levels was 2.3 feet from October 1986 to October 1987. In the last 100 years, just three times have water levels dropped three feet or more within two years – 1929-1931, 1986-1988, and 1999-2000 (when comparing similar months between years to account for seasonal effects). So even under ideal conditions for water levels to decrease, we should expect above average water levels for at least the next two years, if not longer.
Myth 2: Because of hot summer temperatures, evaporation should cause lake levels to decrease.
Fact: As we learned about at the beginning of the blog Lake water levels are higher in the summer and lower in the winter. If hot summers caused evaporation this trend would be the opposite. Fall and winter are actually when most of the evaporation happens and is the time of year we typically see water levels decrease. This happens as the air temperature starts to cool down and dry out (more on that later). It is difficult to tell directly how much water is evaporating form the Great Lakes because of the limitation in collecting this data. Instead, we have to rely on other direct observations from the Net Basin Supply (see myth 2) in order to infer how much water is evaporating.
“Evaporation rates are affected by atmospheric variables, such as humidity, [temperature, and] wind speed” (Gronewold, 2015). There are 3 drivers for evaporation to happen:
- Warm water temperatures and cold air temperatures
- Low, relative humidity
- High wind speeds
These conditions are met in the fall and winter months. During the fall, the air temperature cools, relative humidity decreases, and the wind picks up. During the winter, increased evaporation also happens when there is less seasonal ice cover on lakes. In fact, so much evaporation can happen in the fall/winter months, up to 0.6 inches per day, it is relatively equivalent to 20 times the flow rate of Niagara Falls!
Myth 3: Precipitation is the main factor in water level fluctuation.
Fact: Precipitation is only one of many factors when it comes to lake levels. Net Basin Supply (NBS) is the main component to determine water levels. There are three components: “overlake precipitation, lake evaporation, and drainage basin runoff—along with diversions in and out of the basin and channel flow between lakes” (Notaro, et.al., 2015). Precipitation is higher in the spring and summer contributing to rising water levels and lower in the fall and winter which allows evaporation and runoff to drive their fall.
The NBS is a compilation of the inputs and outputs of water in each of the Great Lakes. It involves the precipitation (P) and runoff (R) entering the Lake minus evaporation (E) and the amount of water leaving the Lake. This measure is an important part of understanding the water balance, essentially the rising and falling of the water levels. [links to past water balance blogs]. The graph below shows the average contributions to the NBS for the Lake Michigan-Huron basin between 1948 and 2008. On an average year NBS tends to be higher in the summer months when precipitation is greater than evaporation and lower in the winter when evaporation is higher than precipitation.
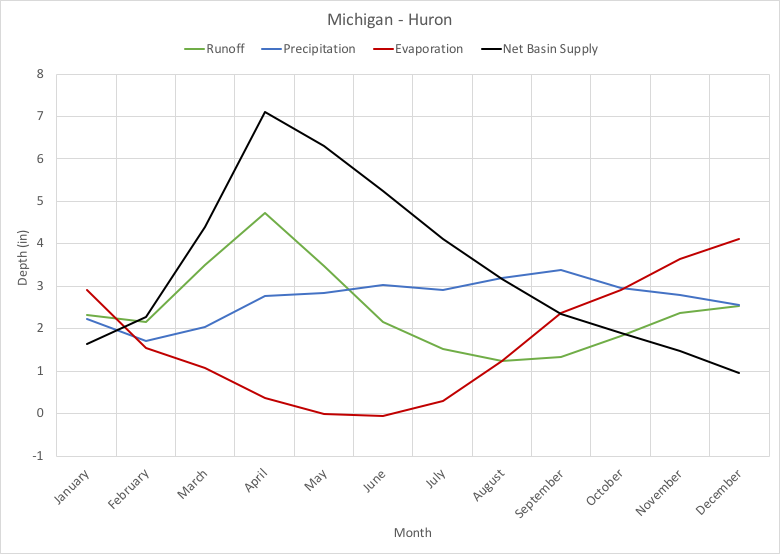
Michigan-Huron Average Net Basin Supply. Created by Lydia Salus, Former Coastal Resilience Project Assistant.
Myth 4: Humans have control over the regulation of the Great Lakes water levels.
Fact: In all actuality, humans have very little effect on the Great Lakes short term or long term water level trends. The Compensating Works dam between Lake Superior and Lake Michigan-Huron (controlled by the International Joint Commission) partially regulates the flow of water out of Lake Superior to Lake Michigan-Huron but does not entirely control the lake levels between the two. Dam regulation operates on a balancing principle “to help balance water level conditions and their impacts on all stakeholders” in Lake Superior and Lake Michigan (International Lake Superior Board of Control Brochure). If the dam is closed lake levels in Lake Superior will increase and, respectively, decrease in Lake Michigan-Huron. However, in the grand scheme of things this regulation is negligible when accounting for high water levels like we have seen in the past year or the low water levels we saw about a decade ago. For example, the maximum allowable flow from Lake Superior to Lake Michigan is 3800 cubic feet per second while the NBS is typically tens of thousands up to hundreds of thousands of cubic feet per second in a given month.
Another myth is that humans can possibly engineer our way out of high water levels through man-made diversions. Take the Chicago river for instance. It used to flow into Lake Michigan. Back in 1900, the Chicago Sanitary and Ship Canal was constructed to make the water flow backwards towards the Mississippi to prevent sewage from entering the lake. Today, this engineering feat diverts about 3200 cubic feet per second of water out of Lake Michigan, an amount dictated by a 1967 U.S. Supreme Court decree (Quinn, 1999). Over the course of an entire year, that is a massive 750 billion gallons of water flowing out of Lake Michigan through the Chicago River. However, that amounts to only about an inch of decrease in lake level. When considering the Great Lakes’ highs and lows, it becomes clear that nature’s ability to fluctuate water levels remains far larger than anything humans are able to do before even considering cost and feasibility of such an effor
Myth 5: Climate change will make water levels go down.
Initially, this was thought to be the case during the period of record-breaking low water levels, circa 2000 – 2015. A common misconception is that increased temperatures and higher evapotranspiration rates were leading to a chronic water loss. Older Global Climate Models (GCM) or Regional Climate Models (RCM) based their predictions mostly on the atmospheric temperature to gauge the amount of evapotranspiration across the Lakes. This leads to an overestimation of evapotranspiration measurements and therefore an inaccurate prediction of future, lower water level trends.
Since this realization, the latest science of lake levels under a changing climate now suggests that there are a few trends we can expect in the future. Extreme weather events are expected to increase. These may be characterized by increased amounts and intensity of precipitation which may cause flooding, as well as periods of extended droughts causing low lake levels. A study by Music et al. (2015) “suggests an amplification of the NBS annual cycle and an intensification of the annual NBS minima in future climate.” This means that overall the amount of water entering and leaving the Great Lakes is expected to be similar in quantity to what we’ve seen historically. However there may will be greater fluctuations between periods of low and high water levels. Climate model simulations done by Notaro, et. al. (2015) also indicate that there will be significant changes in precipitation, runoff, and evaporation in the seasonal cycles by the mid and late 21st century. In addition, there is evidence that weather changes in the arctic may “influence Great Lakes ice cover, Lake effect snow events, seasonal freeze-thaw dynamics, as well as lake levels” (Gronewold, 2019), which would then affect evaporation patterns currently seen. So while there is no longer a clear scientific consensus about a lake levels entering a new regime of consistently low (or high) lake levels under a changing climate, there is an expectation that we may see higher highs, lower lows, and more drastic changes between these extremes.
Sources:
Gronewold, A. D., et al. (2015), Impacts of extreme 2013–2014 winter conditions on Lake Michigan’s fall heat content, surface temperature, and evaporation, Geophys. Res. Lett., 42, 3364–3370, DOI:10.1002/2015GL063799.
Gronewold, A.D. Rood, R.B. (2019) Recent water level changes across Earth’s largest lake system and implications for future variability. Journal of Great Lakes Research. https://doi.org/10.1016/j.jglr.2018.10.012
Music, B., et. al., (2015) Present and future Laurentian Great Lakes hydroclimatic conditions as simulated by regional climate models with an emphasis on Lake Michigan-Huron. Climate Change: ISSN 0165-0009, Volume 130, Number 4. DOI: 10.1007/s10584-015-1348-8
Notaro, M., Bennington, V., Lofgren, B. (2015) Dynamic downscaling – Based projections of Great Lakes Water Levels. American Meteorological Society. http://dx.doi.org/10.1175/JCLI-D-14-00847.s1.
Lenters, J. D., J. B. Anderton, P. Blanken, C. Spence, and A. E. Suyker. (2013) Assessing the Impacts of Climate Variability and Change on Great Lake Evaporation. In: 2011 Project Reports. D. Brown, D. Bidwell, and L. Briley, eds. Available from the Great Lakes Integrated Sciences and Assessments (GLISA) Center: http://glisaclimate.org/media/GLISA_Lake_Evaporation.pdf