


September 25, 2019
By Adam Bechle, Coastal Engineering Outreach Specialist, Wisconsin Sea Grant
The water levels on all of the Great Lakes remain very high, with every lake above or within a few inches of its record high monthly mean. Lakes Superior and Erie broke their record high monthly mean for August while Lake Michigan-Huron was three inches below its record high monthly mean. There is a good chance that we’ve seen the highest water levels for the year, as the “seasonal decline” in water levels has begun.
Here are five things to know about water levels on Lake Michigan for September 2019.
What are the current water levels on Lake Michigan?
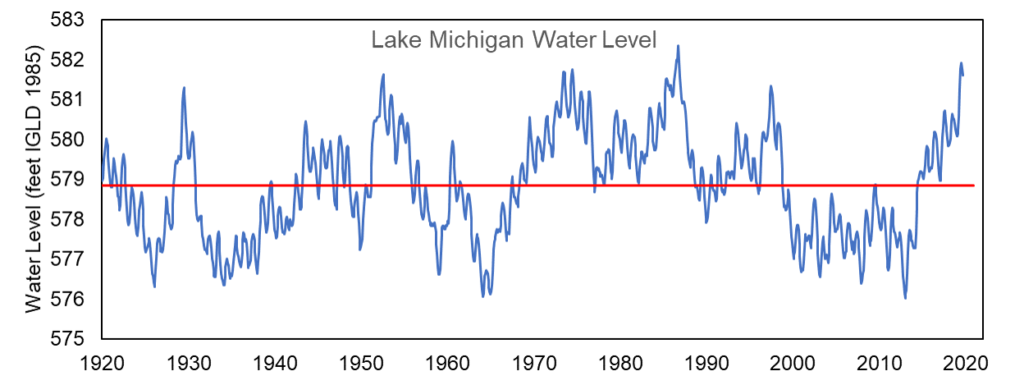
The water level of Lake Michigan as of September 20th, 2019 is at an elevation of 581.63 feet above sea level (from the International Great Lakes Datum). To put this level into perspective, here are some statistics for Lake Michigan relative to the period of water level records measured from 1918 to 2018: (statistics from U.S. Army Corps of Engineers Weekly Water Level Update)
| Compared to… | Current Water Levels are… |
| One month ago | 2 inches lower |
| One year ago | 14 inches higher |
| Average September (from 1918 to 2018) | 30 inches higher |
| Record September monthly mean (set in 1986) | 4 inches below |
| Record high for any month (set in October 1986) | 9 inches below |
What is the outlook for future water levels?
The US Army Corps of Engineers projects Lake Michigan to remain near record high levels for the foreseeable future (see six-month forecast issued for September 2019 below). Water levels have begun their seasonal decline, with a projected drop of about 3 inches by October 20th, 2019. This decrease in water levels is expected throughout the fall and winter as precipitation and runoff into the lakes typically decreases and evaporation from the lakes increases. In an average year, water levels vary seasonally by about one foot from a peak in summer to a low in winter, though every year is different. Water levels would be expected to begin a seasonal rise again next spring when runoff and precipitation increase.
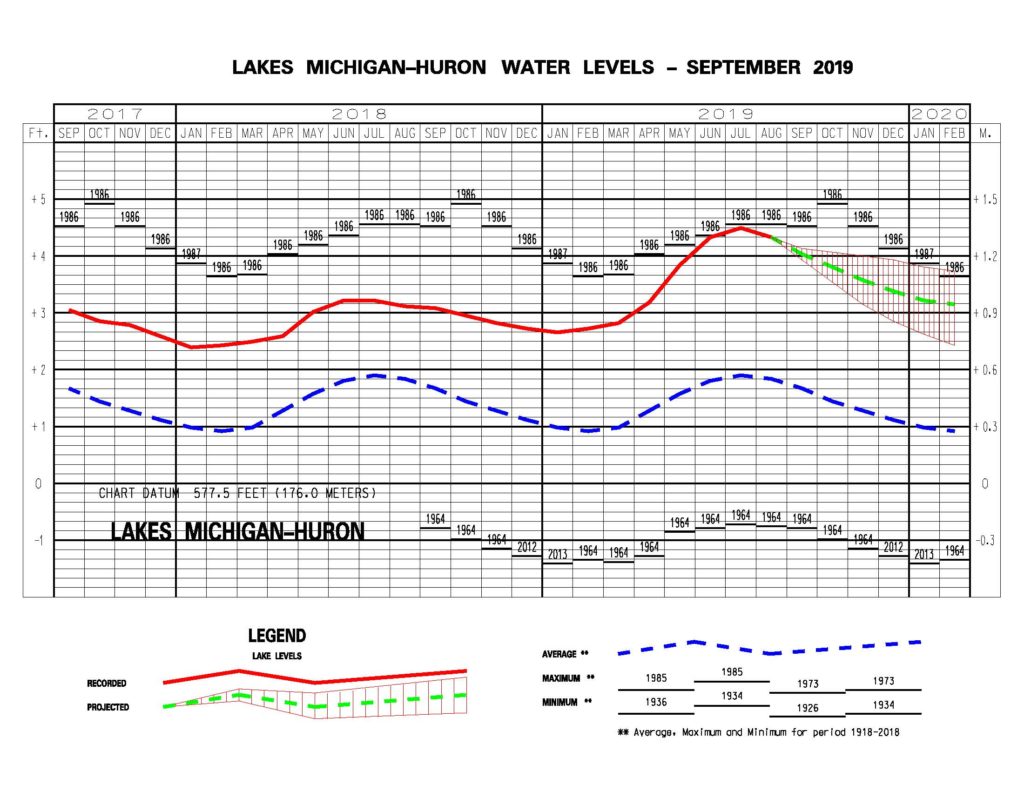
Six month water level forecast for Lake Michigan issued September 2019. Source: U.S. Army Corps of Engineers – https://www.lre.usace.army.mil/Missions/Great-Lakes-Information/Great-Lakes-Water-Levels/Water-Level-Forecast/Monthly-Bulletin-of-Great-Lakes-Water-Levels
Why are lake levels so high?
The story of Great Lakes water level changes is told by Net Basin Supply. Net Basin Supply accounts for water going into a lake in the form of precipitation and runoff minus water leaving a lake due to evaporation of water from the lake surface. In general, when Net Basin Supply is positive, more water enters the lake than leaves, yielding a rise in lake levels. Over the last five years, Net Basin Supply has been consistently positive, driving all the Great Lakes to rise. This is shown in the graph below, where blue indicates a positive Net Basin Supply and red is a negative Net Basin Supply – note there’s a lot more blue than red. In fact, Net Basin Supply in Lake Michigan-Huron had been above-average for ten consecutive months until last month. August 2019 had below average precipitation (32% below normal) coupled with elevated evaporation, giving Lake Michigan-Huron its first relief from an excess supply of water since this time last year.
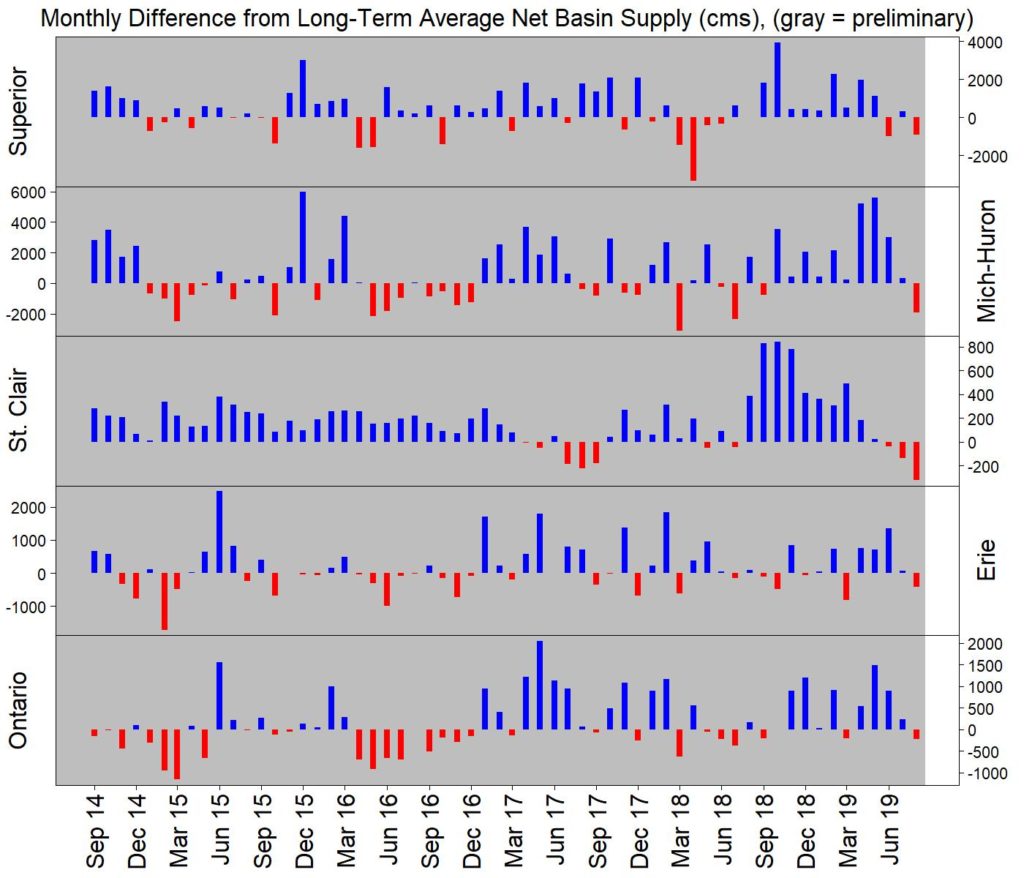
Net Basin Supply to the Great Lakes, where blue indicates a positive NBS and red is a negative NBSSource: US Army Corps of Engineers – http://lre-wm.usace.army.mil/ForecastData/GLBasinConditions/monthlyNBSPast5Years.jpg
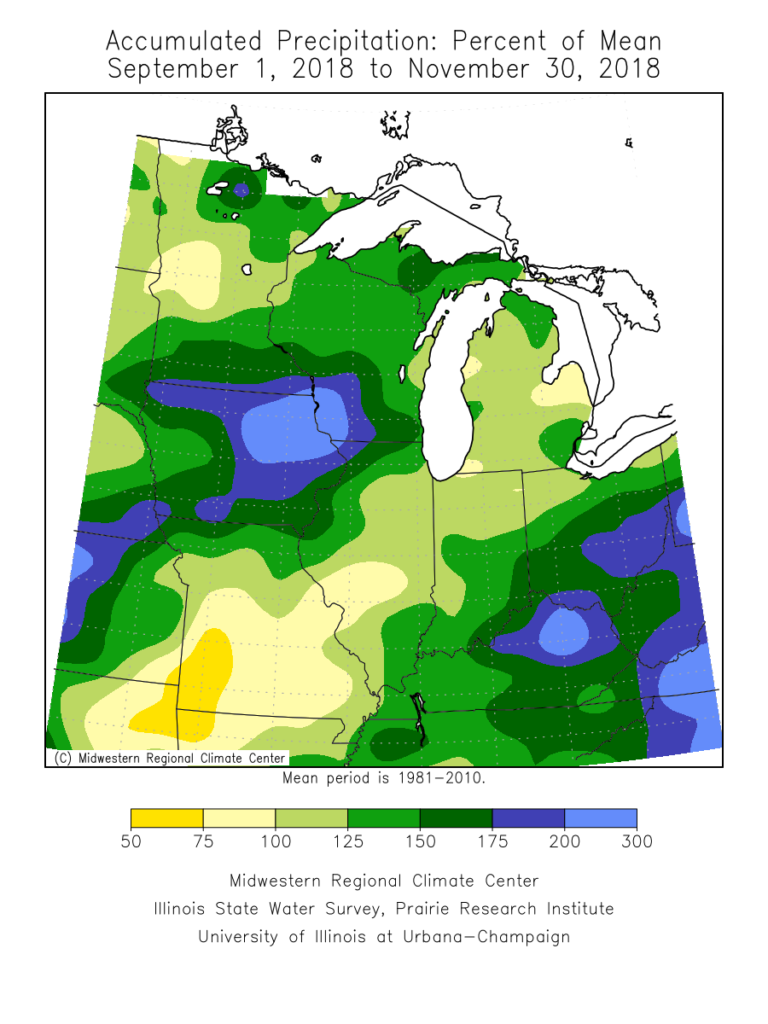
One of the main drivers of our consistently high Net Basin Supply and high lake levels has been above average precipitation. The maps below show precipitation in the Midwest for the past year relative to average amounts (available from the Midwest Regional Climate Center – https://mrcc.illinois.edu/cliwatch/watch.htm#). Green and blue colors show above average precipitation while yellows show below average precipitation. These maps provide a visualization of the above average precipitation that’s been driving our recent spike in water levels across the Great Lakes.
 |
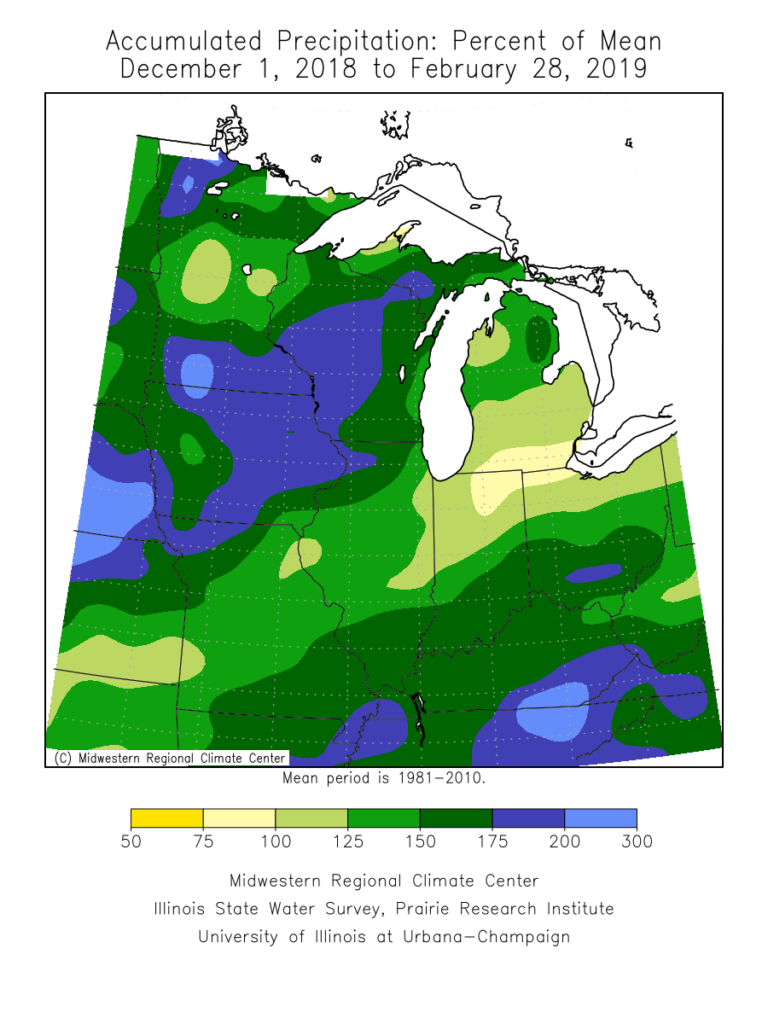 |
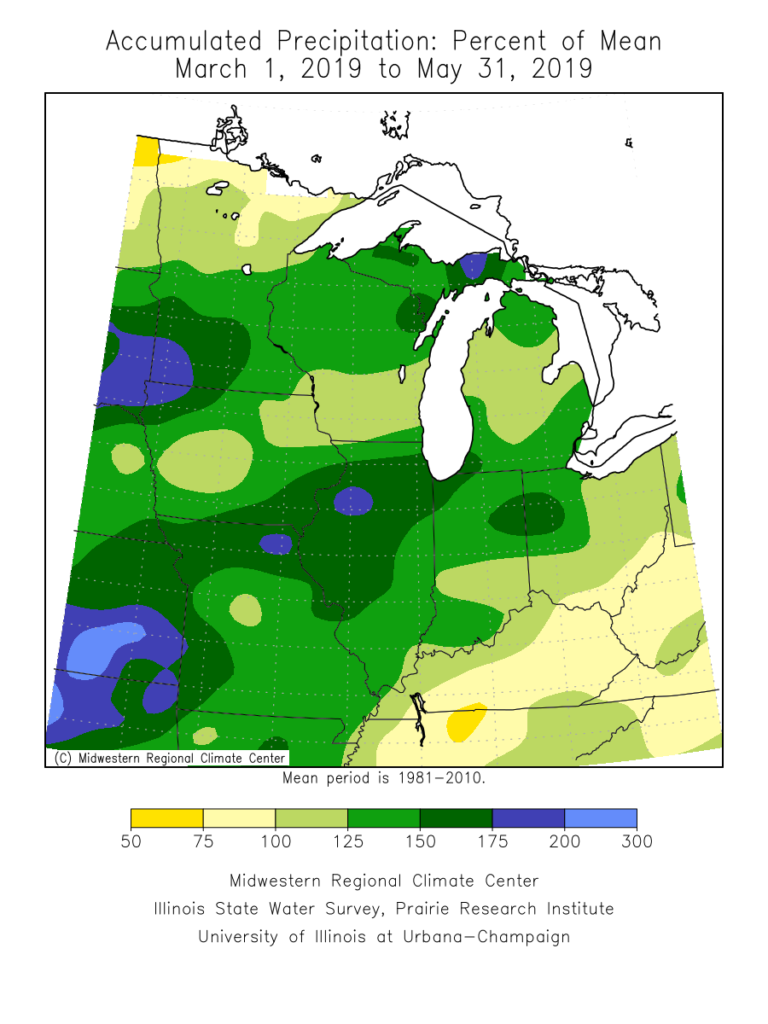 |
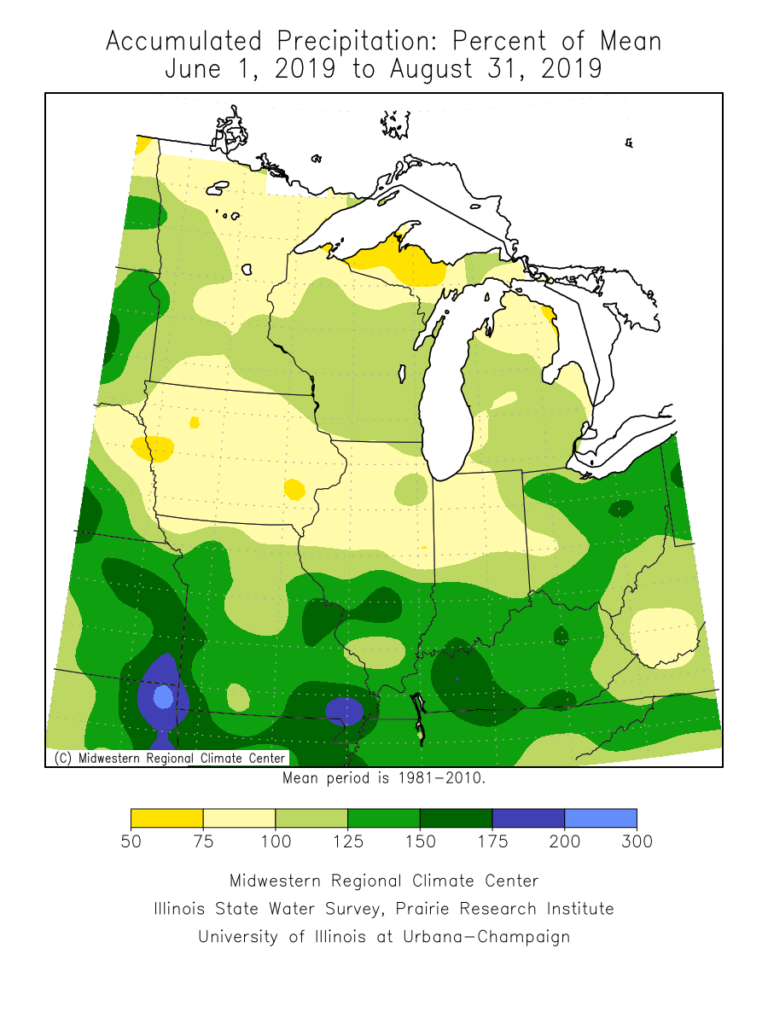 |
What would make water levels go down?
The historic record shows that water levels in the Great Lakes rise and fall with changes in precipitation and evaporation, so we know our high water levels will not be around forever. But what are the perfect conditions that would help water levels go down sooner rather than later? According to Keith Kompoltowicz, chief of watershed hydrology at the U.S. Army Corps of Engineers’ Detroit district “A cool, dry fall would evaporate water from the lakes because the lakes are relatively warm. As we move into the winter, we don’t want a healthy snowpack. We want a warm, snowless winter followed by a warm, dry spring.” Those would be the ideal conditions – low precipitation and runoff with high evaporation – to get a below average Net Basin Supply which would draw down lake levels a bit.
How realistic are these “ideal” conditions? They would certainly be abnormal but the Great Lakes has experienced dramatic drops in water levels in the past. The U.S. Army Corps of Engineers provides some scenarios of how current lake levels would change under the conditions that were experienced in notable years in the past. For example, 1998-1999 had very low Net Basin Supplies due to a warm winter and spring that set the table for increased evaporation coupled with below average precipitation which kept water out of the lakes. From September 1998 to September 1999, Lake Michigan-Huron water levels decreased almost 1.5 feet and continued to drop into the following year. It is unlikely that the Great Lakes will experience those “ideal” conditions yet this year but it’s important to remember that the Great Lakes go down just like they go up.
Where can I go for more information?
See our Coastal Hazards page for details about the impacts of high water levels, including erosion, flooding, and navigation issues.
Our blog post Resources for Great Lakes Coastal Property Owners: Where do I start? and Resilience Resources have links to many resources to help understand coastal hazards, weigh the risks coastal hazards pose to property, understand options for addressing these hazards, and get started on implementing actions if necessary. One featured resource includes Adapting to a Changing Coast: Options and Resources for Lake Michigan Property Owners (pictured right)
Great Lakes Water Budgets from the University of Michigan gives a bit more information into what makes the lakes go up and down
The US Army Corps’ Great Lakes Information page has tons of details on water levels. For more information, check out our Resource of the Month feature here.