


February 26, 2022
By Caitlin Piotrowski, Wisconsin Sea Grant
Water Levels on Lake Michigan-Huron
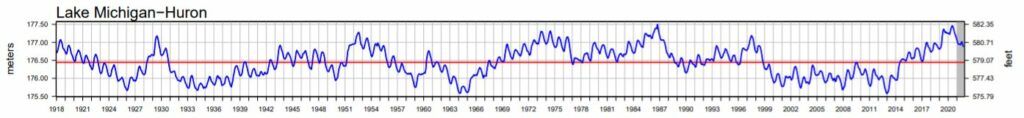
Lake Michigan water levels have continued their seasonal decline this fall, decreasing by about 2 inches from January to February. Though Lake Michigan is now about 28 inches below the highest monthly water level recorded for February in 2020, the Lake is still about 9 inches above the long-term average water level. Water levels are expected to continue their seasonal decline through the early winter but remain above the long-term average.
Watch the USACE’s “On the Level” Youtube channel for monthly updates and information about the Great Lakes’ water levels and forecasts from Detroit District Hydraulics and Hydrology experts.
Here are five things to know about water levels on Lake Michigan for February 2022.
What are the current water levels on Lake Michigan?
The water level of Lake Michigan as of February 18, 2022, is at an elevation of 579.20 feet above sea level (from the International Great Lakes Datum). To put this level into perspective, here are some statistics for Lake Michigan relative to the period of water level records measured from 1918 to present: (statistics from USACE’s Weekly Water Level Update and USACE’s Water Level Summary
| Compared to… | Current Water Levels are… |
| One month ago | 2 inches lower |
| One year ago | 18 inches lower |
| Long-term February monthly average (1918 to 2021) | 9 inches higher |
| Record February monthly mean (set in 2020) | 28 inches lower |
What is the outlook for future water levels?
Water levels on Lake Michigan have decreased by about 2 inches from January to February. The USACE is projecting that water levels will remain steady and stay around the current levels throughout February 2022 (see the water level forecast issued for February 2022 below). A decrease in water levels generally occurs throughout the fall and winter as precipitation decreases and evaporation increases due to cooler air temperatures and increased wind speeds. In an average year, water levels vary seasonally by about one foot from a peak in summer to a low in winter, though every year is different. You can read more about this as well as other myths on water level fluctuations on this blog.

Six-month water level forecast for Lake Michigan issued for this month. Source: U.S. Army Corps of Engineers. https://www.lre.usace.army.mil/Missions/Great-Lakes-Information/Great-Lakes-Water-Levels/Water-Level-Forecast/Monthly-Bulletin-of-Great-Lakes-Water-Levels/
What is behind Great Lakes water level fluctuations?
The story of Great Lakes water level changes is told by Net Basin Supply. Net Basin Supply (NBS) accounts for water going into a lake in the form of precipitation and runoff minus water leaving a lake due to evaporation of water from the lake surface. In general, when Net Basin Supply is positive, more water enters the lake than leaves, causing a rise in lake levels. When Net Basin Supply is negative, more water leaves the lake than enters, causing a drop in lake levels. (Click here for more detail).
What is making water levels go down?
For the second half of 2021, Lake Michigan’s NBS was fluctuating above and below the long-term average NBS. This is visualized on the graph below, which shows the monthly difference from the long-term average NBS for the past five years. Red bars represent below average NBS whereas blue bars represent above average NBS. In late 2021, more water was entering the lake through precipitation and runoff than leaving the lake through evaporation. Recently, September saw below average NBS and October saw above average NBS. However, water levels are still down substantially from the record-setting 2020.
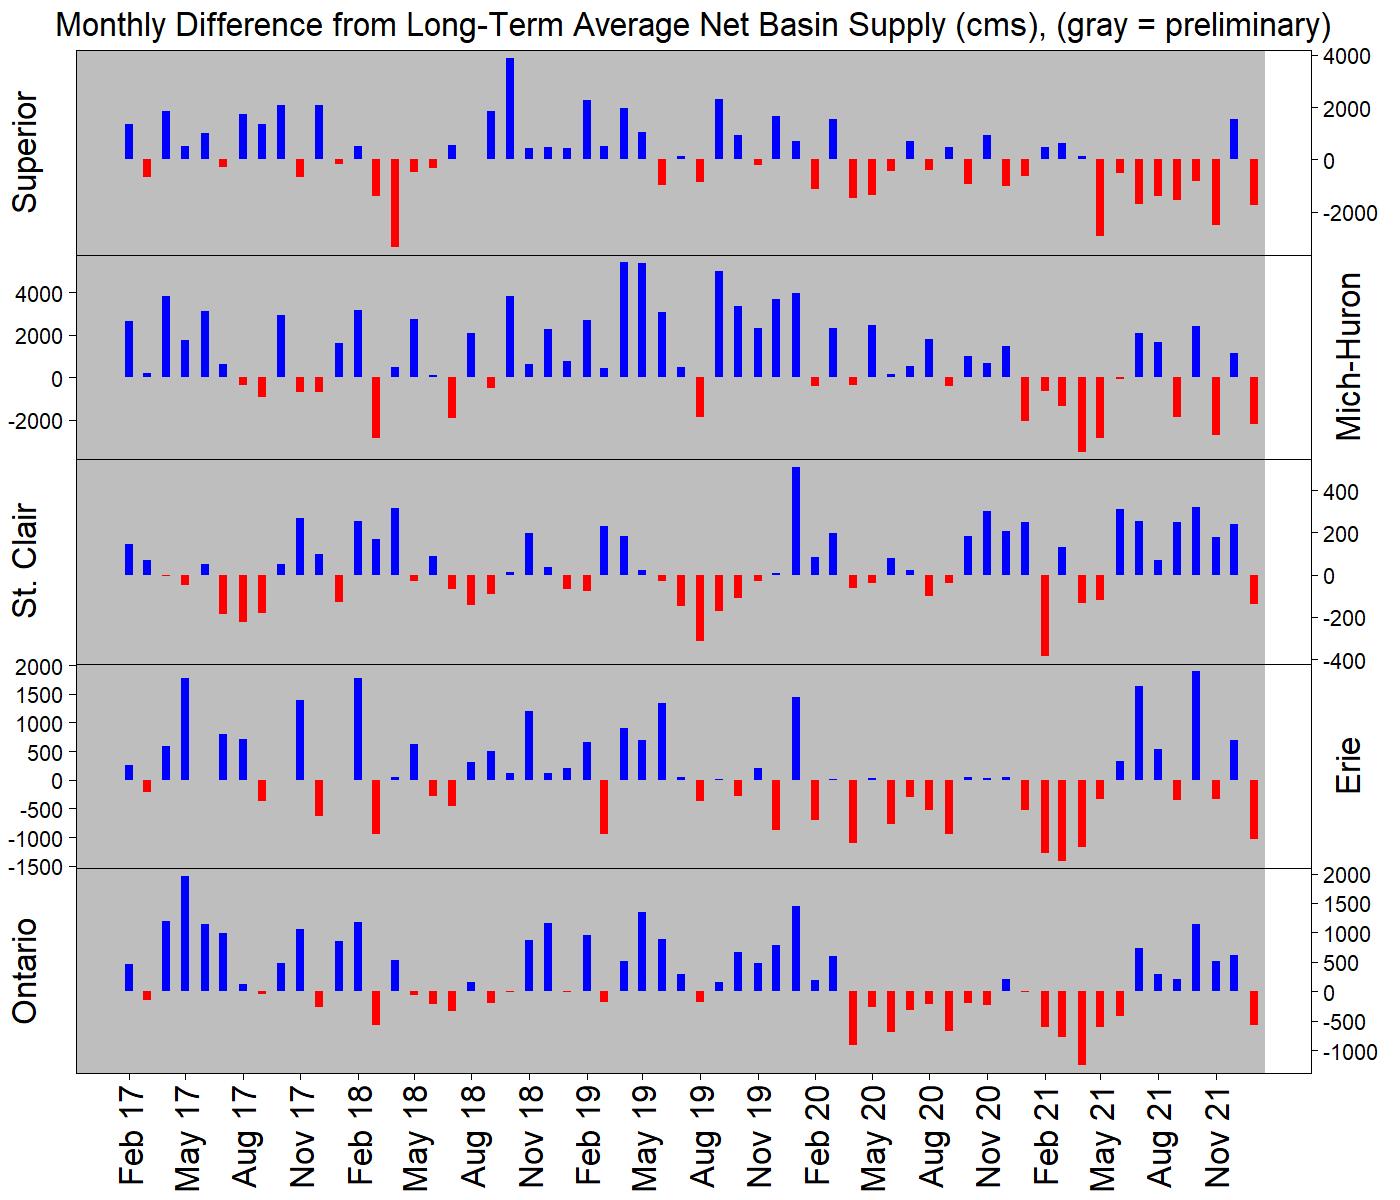
This image shows NBS relative to long term average NBS for the past 5 years. https://www.lre.usace.army.mil/Missions/Great-Lakes-Information/Great-Lakes-Information-2/Basin-Conditions/#lkmih
How does ice cover impact water levels?
As of February 18th, 2022, the predicted maximum ice cover on Lake Michigan is 30.5%. This is 9.7% lower than the long-term average annual maximum ice cover (AMIC). A low amount of ice cover leads to increased evaporation throughout the winter, which accelerates decreasing water levels. The graph below shows current ice cover conditions on the Great Lakes. The greys indicate ice, whereas the blue colors indicate the temperature of the water that is not covered. To learn more about ice cover on the Great Lakes, check out this page from NOAA.
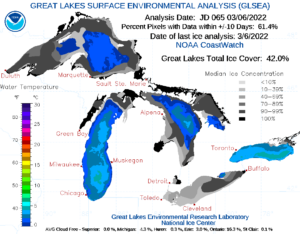
This image shows the current ice cover conditions on the Great Lakes. https://www.glerl.noaa.gov/res/glcfs/glsea.html
Places you can find more relevant  information
- Our Coastal Hazards page for details about the impacts of high water levels, including erosion, flooding, and navigation issues.
- Our blog post Resources for Great Lakes Coastal Property Owners: Where do I start? has links to many resources to help
- understand coastal hazards
- weigh the risks coastal hazards pose to property
- understand options for addressing these hazards
- get started on implementing actions if necessary.
- The Great Lakes Water Budgets from the University of Michigan gives more information about what makes the lakes go up and down.
- The US Army Corps’ Great Lakes Information page has tons of details on view water level data, water level forecasts, basin conditions, outflows, etc.
- Our Resource of the Month on US Army Corps of Engineers Monthly Bulletin of Great Lakes Water Levels.