


February 15, 2021
By Kayla Wandsnider, Coastal Resilience Project Assistant, Wisconsin Sea Grant
Water Levels on Lake Michigan-Huron
The water levels on all the Great Lakes have continued to be below their monthly records as of February 15, 2021. Lake Michigan is now 10 inches below the highest recorded monthly average in February previously set just last year in 2020. This is the first time since August of 2019 that the Net Basin Supply for the Lake Michigan-Huron Basin has been negative. From this point and through the winter, water levels are expected to continue their seasonal decline. It is predicted that Lake Michigan-Huron will fall about 1-2 inches by this same time next month.
Quick links to other February website updates:
Resource of the Month: Funding and Financing for Coastal Resiliency
Around the Great Lakes: Duluth Reconstructing Lakewalk to be Climate Resilient
Here are five things to know about water levels on Lake Michigan for February 2021.
What are the current water levels on Lake Michigan?
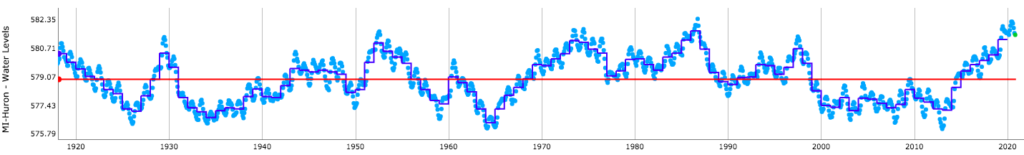
The water level of Lake Michigan as of February 15, 2021, is at an elevation of 580.68 feet above sea level (from the International Great Lakes Datum). To put this level into perspective, here are some statistics for Lake Michigan relative to the period of water level records measured from 1918 to present: (statistics from USACE’s Weekly Water Level Update and USACE’s Water Level Summary
| Compared to… | Current Water Levels are… |
| One month ago | 4 inches lower |
| One year ago | 10 inch lower |
| Long-term February monthly average (1918 to 2019) | 27 inches higher |
| Record February monthly mean (set in 2020) | 10 inches lower |
What is the outlook for future water levels?
Over the last month, water levels have decreased by 4 inches. The US Army Corps of Engineers (USACE) predicts that all lakes will continue their seasonal water level declines through the winter (see six-month forecast issued for February 2021 below). Seasonally, this is what we expect declining water levels due to evaporation. Water levels generally increase during the spring with higher amounts of precipitation and snowmelt. They tend to level off then decrease at the end of the summer and through the fall as temperatures cool, evaporation increases, and wind speeds pick up. In an average year, water levels vary seasonally by about one foot from a peak in summer to a low in winter, though every year is different. You can read more about this as well as other myths on water level fluctuations on this blog.
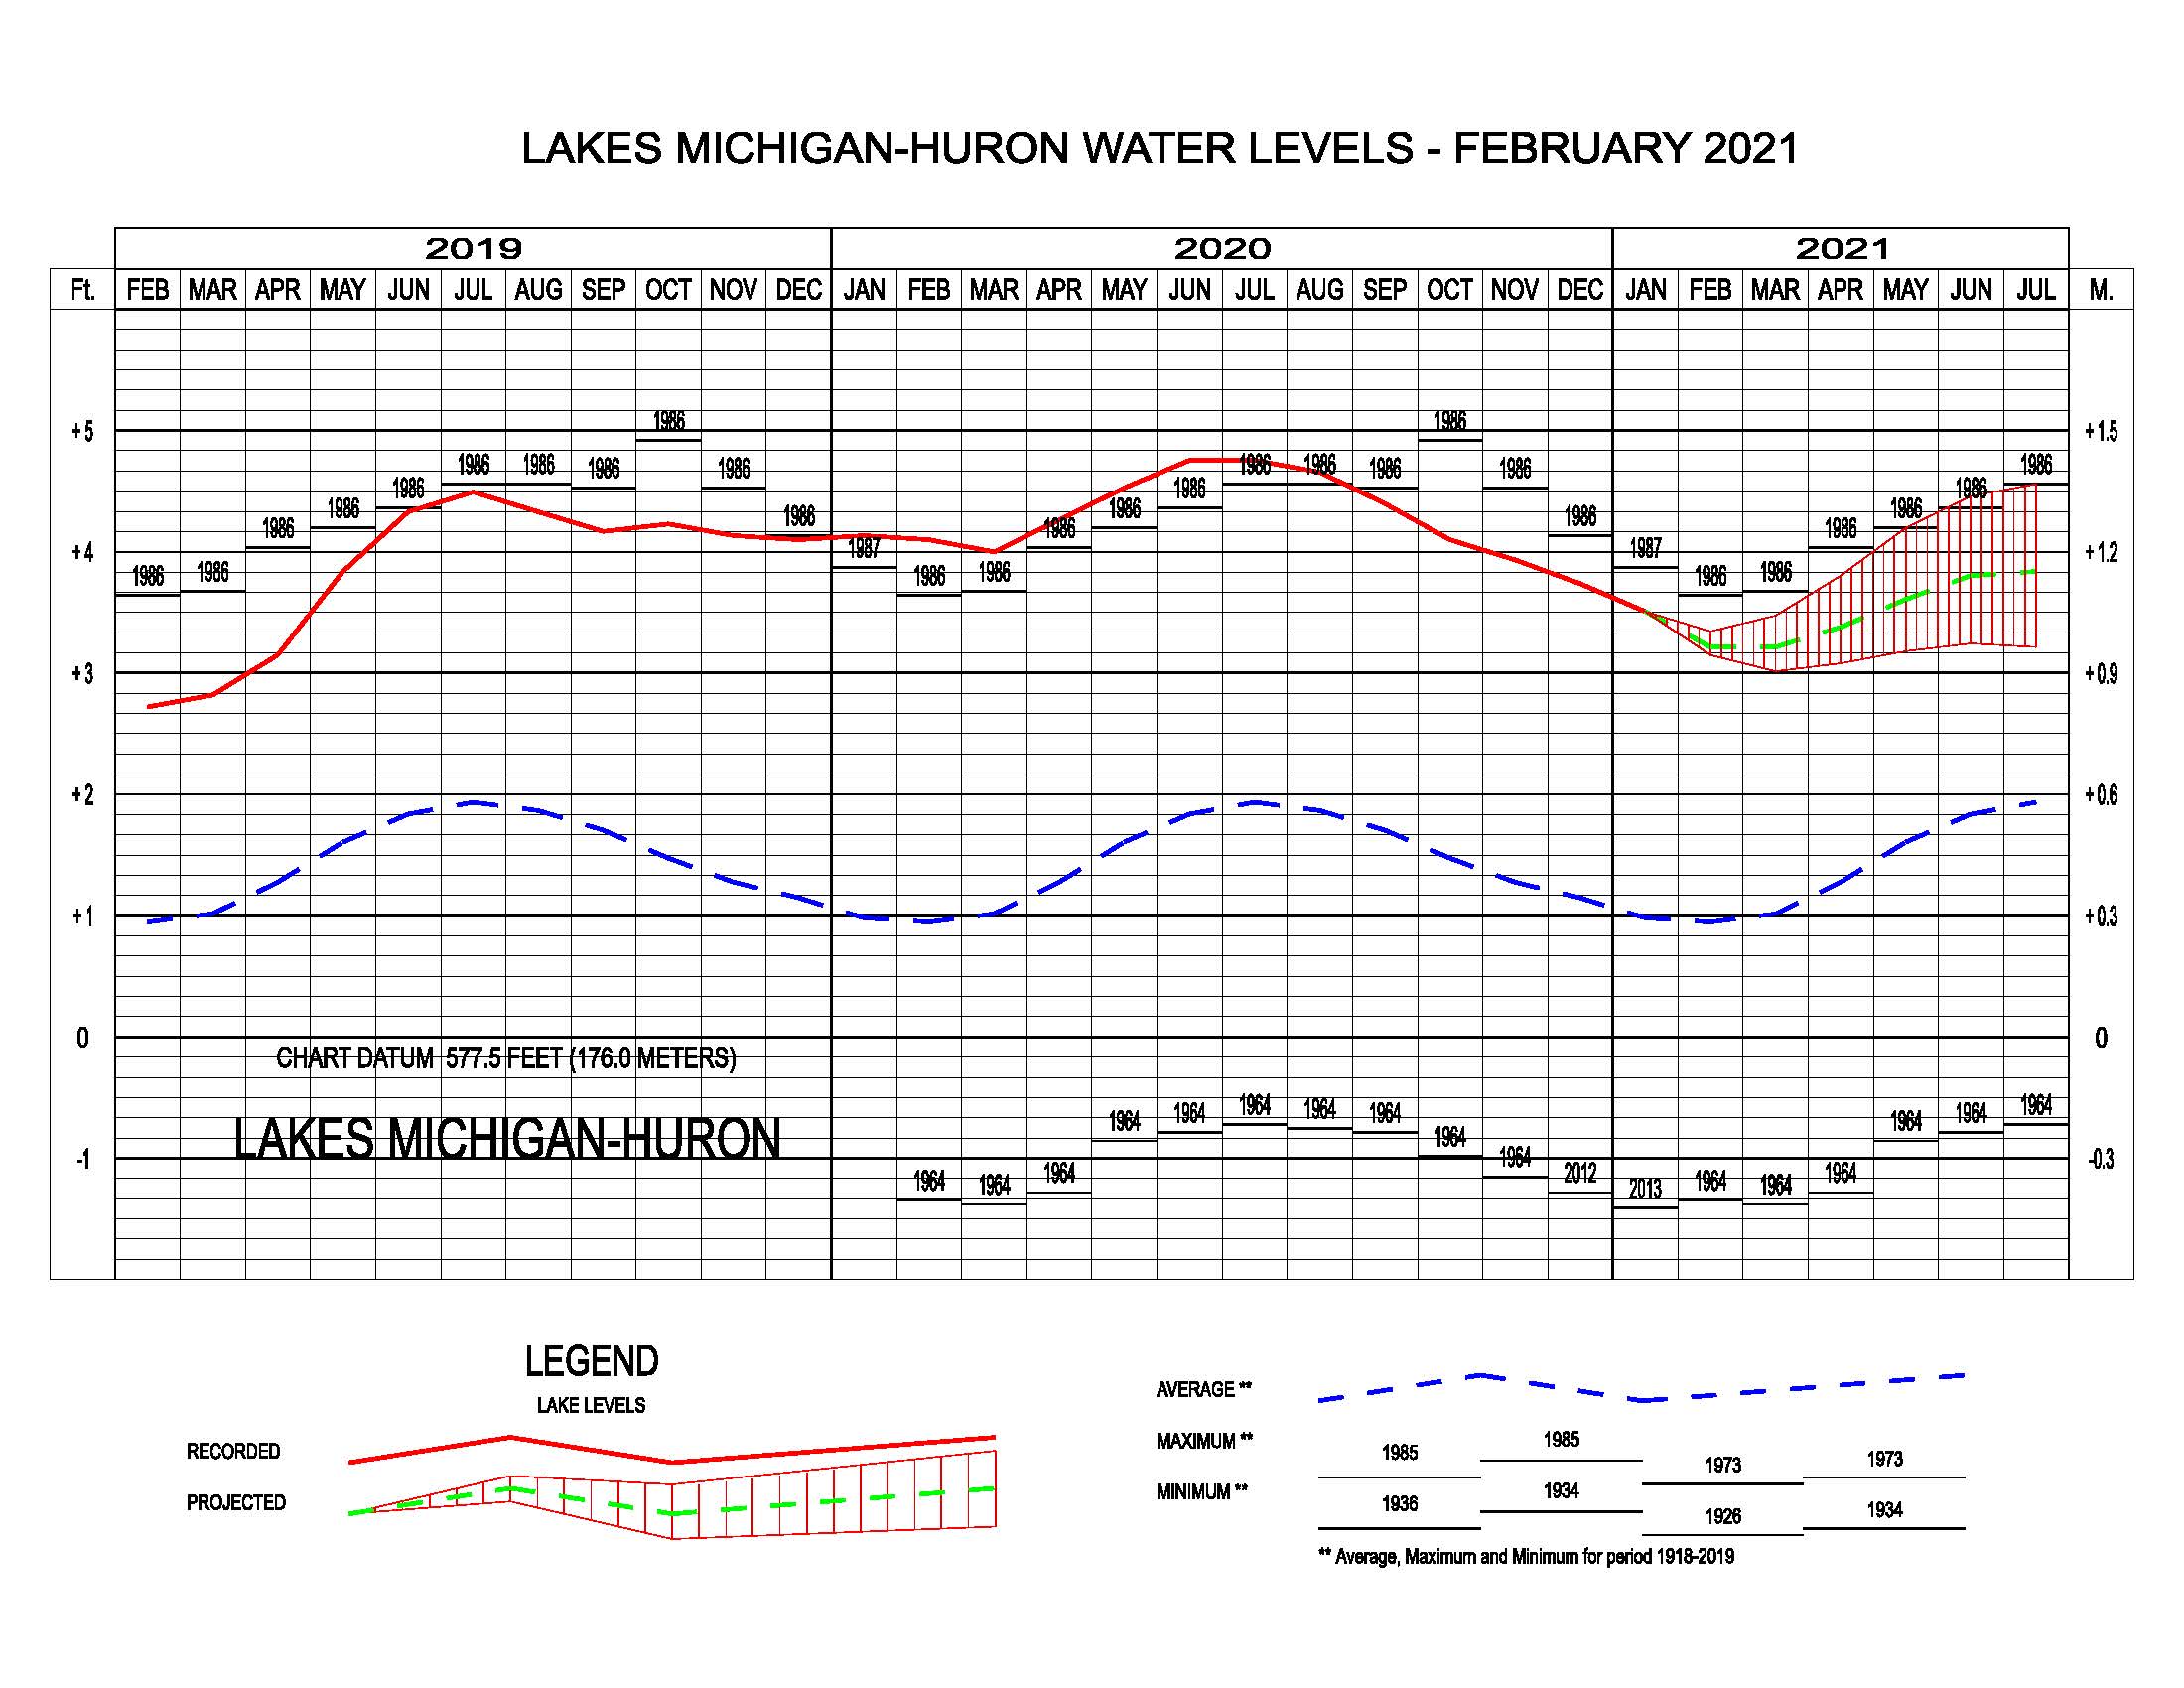
Six-month water level forecast for Lake Michigan issued for February 2021. Source: U.S. Army Corps of Engineers. https://www.lre.usace.army.mil/Missions/Great-Lakes-Information/Great-Lakes-Water-Levels/Water-Level-Forecast/Monthly-Bulletin-of-Great-Lakes-Water-Levels/
What is behind Great Lakes water level fluctuations?
The story of Great Lakes water level changes is told by Net Basin Supply. Net Basin Supply (NBS) accounts for water going into a lake in the form of precipitation and runoff minus water leaving a lake due to evaporation of water from the lake surface. In general, when Net Basin Supply is positive, more water enters the lake than leaves, causing a rise in lake levels. Over the last five years, Net Basin Supply has been consistently positive, driving all the Great Lakes to rise (Click here for more detail).
In January 2021, Lake Michigan water levels have declined due as seen with a negative Net Basin Supply. Potentially, this could have been caused by significantly lower amounts of precipitation, around 30% of its average for the month. Second, there was a higher outflow from the Lake Michigan-Huron basin to Lake Erie through the St. Claire River than average. And third, this time of year, as mentioned before, has higher amounts of evaporation than other seasons. The combination of these three factors could have led to a decline in water levels.
Lake Michigan’s NBS for the year 2020 and the start of 2021 is cumulatively above average. This means that there has, in total, been more water entering the Lake than leaving it compared to a normal year. This cumulative above-average NBS drove Lake Michigan to consistent monthly record highs throughout 2020. So, you can see on the chart below, when the green bar (2020 NBS) is higher than the blue bar (historic average NBS), more water enters the lake than on average for that month (and vice versa). In order for Lake Michigan water levels to actually go down appreciably (beyond just seasonal fluctuations), we would need to consistently see green bars lower than the blue bars.
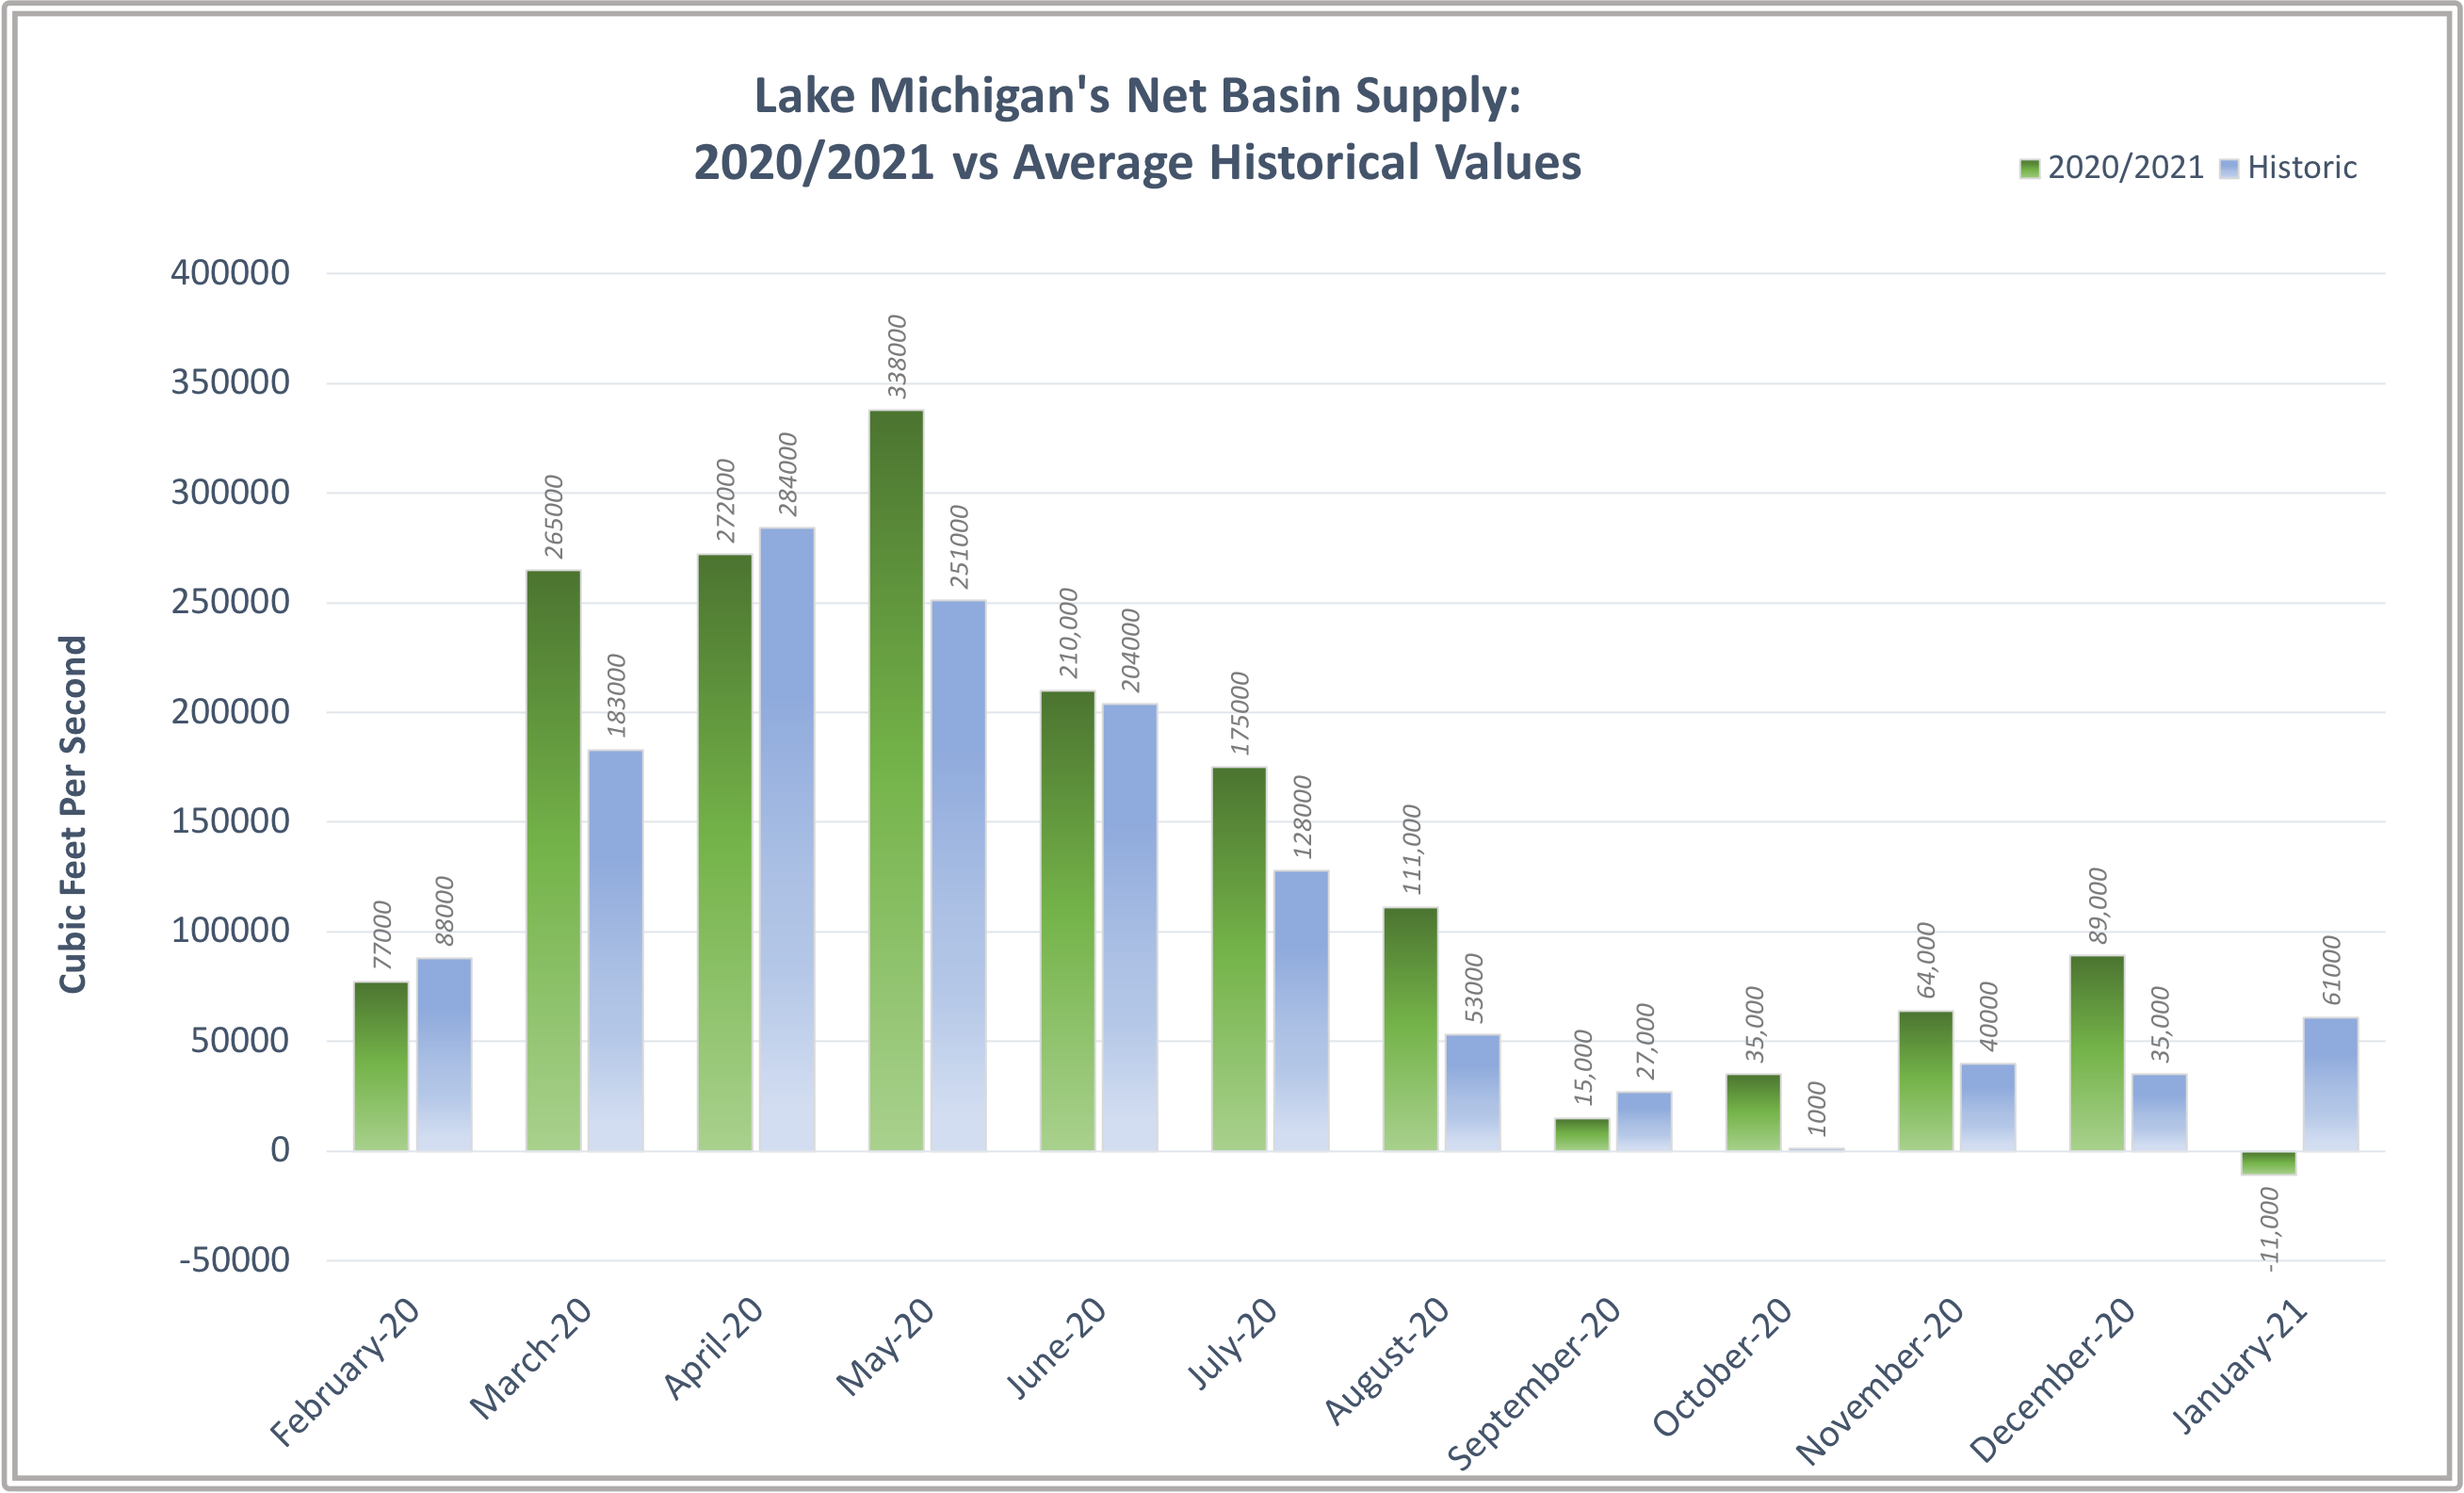
This image shows a comparison between the current and the average NBS recorded between 1900 – 2008. Calculations based on the Army Corps of Engineers Great Lakes Basin Hydrology Summaries. https://www.lre.usace.army.mil/Missions/Great-Lakes-Information/Great-Lakes-Information-2/Basin-Conditions/
What would make water levels go down?
The historic record shows that water levels in the Great Lakes fluctuate between periods of highs and low with changes in precipitation and evaporation, so we know our high water levels will not be around forever. But what are the perfect conditions that would help water levels go down sooner rather than later? According to Keith Kompoltowicz, Deputy Chief of Engineering at the USACE’s Detroit District “A cool, dry fall would evaporate water from the lakes because the lakes are relatively warm. As we move into the winter, we don’t want a healthy snowpack. We want a warm, snowless winter followed by a warm, dry spring. Big picture is that we’re looking at another year of very high and even record high water levels, and the impacts associated with those are going to remain.” Those would be the ideal conditions – low precipitation and runoff with high evaporation – to get a below-average Net Basin Supply which would draw down lake levels. If you are curious to learn more about what drives lake level fluctuation check out this blog on Myth Busting Evaporation on the Great Lakes and other Water Level Fluctuations.
Places you can find more relevant  information
- Our Coastal Hazards page for details about the impacts of high water levels, including erosion, flooding, and navigation issues.
- Our blog post Resources for Great Lakes Coastal Property Owners: Where do I start? has links to many resources to help
- understand coastal hazards
- weigh the risks coastal hazards pose to property
- understand options for addressing these hazards
- get started on implementing actions if necessary.
- The Great Lakes Water Budgets from the University of Michigan gives more information about what makes the lakes go up and down.
- The US Army Corps’ Great Lakes Information page has tons of details on view water level data, water level forecasts, basin conditions, outflows, etc.
- Our Resource of the Month on US Army Corps of Engineers Monthly Bulletin of Great Lakes Water Levels.