


September 30, 2021
By Adam Bechle, Coastal Engineering Outreach Specialist, Wisconsin Sea Grant
Water Levels on Lake Michigan-Huron
Lake Michigan water levels have begun their seasonal decline this fall, decreasing by 2 inches this month. Water level fluctuations can be explained by the Net Basin Supply (NBS) and this past June was the first month this year where NBS was above average. Next month, Lake Michigan-Huron basins are expected to decrease 3 inches by October. Lake Michigan is now 17 inches below the highest recorded monthly average in September set in 1986.
Watch the USACE’s “On the Level” Youtube channel for monthly updates and information about the Great Lakes’ water levels and forecasts from Detroit District Hydraulics and Hydrology experts.
Quick links to other August website updates:
Around the Great Lakes: Lake Huron Integrated Assessment
Resource of the Month: Summary of FEMA Hazard Mitigation Assistance Grant Programs
Here are five things to know about water levels on Lake Michigan for September 2021.
What are the current water levels on Lake Michigan?
The water level of Lake Michigan as of September 24, 2021, is at an elevation of 580.51 feet above sea level (from the International Great Lakes Datum). To put this level into perspective, here are some statistics for Lake Michigan relative to the period of water level records measured from 1918 to present: (statistics from USACE’s Weekly Water Level Update and USACE’s Water Level Summary
| Compared to… | Current Water Levels are… |
| One month ago | 2 inch lower |
| One year ago | 14 inches lower |
| Long-term September monthly average (1918 to 2020) | 16 inches higher |
| Record September monthly mean (set in 1986) | 17 inches lower |
What is the outlook for future water levels?
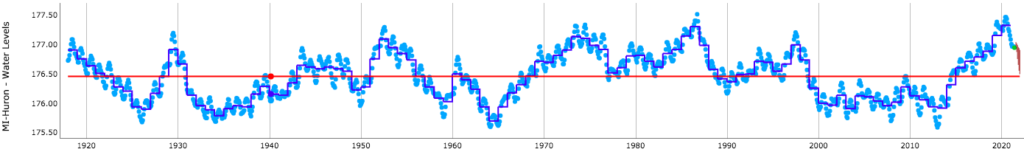
Water levels on Lake Michigan have decreased by 2 inches since last month. The USACE is projecting that water levels will decrease by about 3 inches by October 2021 (see six-month forecast issued for September 2021 below). An increase in water levels generally occurs throughout the spring as precipitation and snowmelt typically increase. They tend to level off then decrease at the end of the summer and through the fall as temperatures cool, evaporation increases, and wind speeds pick up. In an average year, water levels vary seasonally by about one foot from a peak in summer to a low in winter, though every year is different. You can read more about this as well as other myths on water level fluctuations on this blog.

Six-month water level forecast for Lake Michigan issued for this month. Source: U.S. Army Corps of Engineers. https://www.lre.usace.army.mil/Missions/Great-Lakes-Information/Great-Lakes-Water-Levels/Water-Level-Forecast/Monthly-Bulletin-of-Great-Lakes-Water-Levels/
What is behind Great Lakes water level fluctuations?
The story of Great Lakes water level changes is told by Net Basin Supply. Net Basin Supply (NBS) accounts for water going into a lake in the form of precipitation and runoff minus water leaving a lake due to evaporation of water from the lake surface. In general, when Net Basin Supply is positive, more water enters the lake than leaves, causing a rise in lake levels. Over the last five years, Net Basin Supply has been consistently positive, driving all the Great Lakes to rise to record levels (Click here for more detail).
What is making water levels go down?
For the first half of 2021, Lake Michigan’s NBS was consistently below the long-term average NBS, resulting in a rather large water level drop. This is visualized on the graph below, where the green bars represent the NBS for the current month compared to the historic average NBS for that month in blue. For much of 2021, the blue bar is higher than the green bar. In other words, more water was leaving the lake through evaporation in early 2021 than entering the lake through precipitation and runoff. Recently, the months of July and August saw above average NBS, leading to a slight increase in water levels. However, water levels are still down substantially from the record-setting 2020.
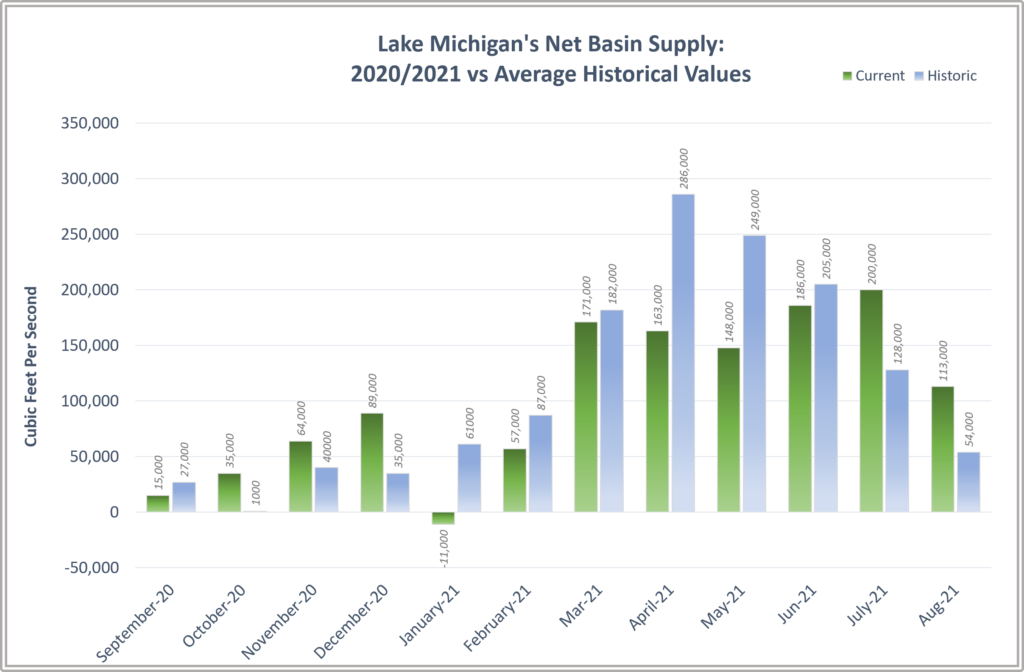
This image shows a comparison between the current and the average NBS recorded between 1900 – 2008. Calculations based on the Army Corps of Engineers Great Lakes Basin Hydrology Summaries. https://www.lre.usace.army.mil/Missions/Great-Lakes-Information/Great-Lakes-Information-2/Basin-Conditions/
Places you can find more relevant  information
- Our Coastal Hazards page for details about the impacts of high water levels, including erosion, flooding, and navigation issues.
- Our blog post Resources for Great Lakes Coastal Property Owners: Where do I start? has links to many resources to help
- understand coastal hazards
- weigh the risks coastal hazards pose to property
- understand options for addressing these hazards
- get started on implementing actions if necessary.
- The Great Lakes Water Budgets from the University of Michigan gives more information about what makes the lakes go up and down.
- The US Army Corps’ Great Lakes Information page has tons of details on view water level data, water level forecasts, basin conditions, outflows, etc.
- Our Resource of the Month on US Army Corps of Engineers Monthly Bulletin of Great Lakes Water Levels.